County
Wayne County, Ohio
Ohio · county seat Wooster · 116,758 residents (July 2025 estimate) · 15 ZIP codes · 33 cities, villages and townships
116,758 people (July 2025 estimate), -0.1% since the 2020 census; life expectancy 75.8 years; median household income $72,275 (2024). The county in numbers
Local events in Wayne County
632 events in the next 90 days from 19 public calendars. All local events in Wayne County
Checked October 20; the events page is refreshed daily.
Wayne County in numbers
The public records that are kept county by county, in 26 blocks. Every figure names its source; a tile's small line gives the comparison or the date.
Population
How many people live here, how the count has moved since 2020 and since 1900, and how the USDA classes the county.
- residents, July 2025 estimate
- 116,758
- Census Bureau vintage 2025
- since the April 2020 census
- -0.1%
- from 116,866 in the Census Bureau's April 2020 estimates base
- births since July 2020
- 6,933
- deaths since July 2020
- 6,874
- net migration since July 2020
- -162
- people who moved in, minus people who moved out
- net domestic migration, 2025
- -95
- moved in from elsewhere in the U.S., minus moved out
- net international migration, 2025
- +169
Wayne County has slightly shrunk since the 2020 census.
It is 3.1 times its 1900 size.
USDA rural-urban continuum code 4 of 9 (1 is the most metropolitan): nonmetro - urban population of 20,000 or more, adjacent to a metro area.
USDA ERS county typology (2015 codes): a nonmetro county with a manufacturing-dependent economy, with none of the ERS distress flags.
| Year | People | Source |
|---|---|---|
| 1820 | 11,933 | first census that counted the county |
| 1850 | 32,981 | decennial census |
| 1900 | 37,870 | decennial census |
| 1950 | 58,716 | decennial census |
| 1970 | 87,123 | decennial census |
| 1990 | 101,461 | decennial census |
| 2000 | 111,562 | Census Bureau estimates base, April 1 |
| 2010 | 114,520 | decennial census |
| 2020 | 116,866 | Census Bureau estimates base, April 1 |
| 2025 | 116,758 | July estimate |
Source: Census Bureau Population Estimates Program (vintage 2025, join_popest.py); decennial counts 1900-1990 from 'Population of States and Counties of the United States 1790-1990', 2000/2010 from intercensal files; USDA ERS Rural-Urban Continuum Codes, 2023; USDA ERS county typology codes, 2015 edition · Census population estimates · USDA ERS county codes · USDA ERS county typology · About this topic
Moving in and out
People on tax returns that changed county between the returns filed in 2022 and 2023, counted by the IRS.
- people moved in, 2022 to 2023
- 3,677
- on tax returns filed from a new county
- people moved out
- 4,120
- net people
- -443
- moved in, minus moved out
- people stayed put
- 94,570
- income that moved in
- $118 million
- adjusted gross income on the arrivals' 2023 returns
- income that moved out
- $138 million
- adjusted gross income on the leavers' 2023 returns
| From | People |
|---|---|
| Summit, OH | 564 |
| Medina, OH | 453 |
| Holmes, OH | 394 |
| To | People |
|---|---|
| Stark, OH | 538 |
| Summit, OH | 471 |
| Medina, OH | 454 |
Source: IRS Statistics of Income county-to-county migration flows, 2022-2023 · IRS migration data · About this topic
Income and poverty
The Census Bureau's 2024 small-area estimates for the county.
- of residents below the poverty line, 2024
- 11.3%
- of children below the poverty line, 2024
- 14.1%
- median household income, 2024
- $72,275
Source: Census SAIPE 2024 county estimates · Census SAIPE · About this topic
Jobs and wages
Unemployment in the latest month and what employers in the county pay, from the Bureau of Labor Statistics.
- unemployment rate, July 2026
- 3.0%
- 4.3% a year earlier
- people in the labor force, July 2026
- 54,909
- looking for work
- 1,649
- average weekly wage, first quarter of 2026
- $1,125
- +3.3% on the year
- jobs covered by unemployment insurance
- 47,775
- -0.4% on the year
- establishments
- 2,996
| Sector | Jobs | Average weekly wage |
|---|---|---|
| manufacturing | 13,536 | $1,371 |
| health care and social assistance | 5,141 | $1,012 |
| retail | 4,930 | $697 |
Source: BLS Local Area Unemployment Statistics; BLS Quarterly Census of Employment and Wages, 2026 Q1 · BLS local unemployment · BLS QCEW · About this topic
The county economy
What the county produces and earns, from the Bureau of Economic Analysis.
- real GDP, 2024 (2017 dollars)
- $7.1 billion
- +8.9% since 2019
- GDP in 2024 dollars
- $9.0 billion
- current dollars, before adjusting for inflation
- personal income per person, 2024
- $61,004
- 27th of Ohio's 88 counties
- change in income per person since 2019
- +33.8%
- before inflation
Source: BEA regional accounts: county GDP (CAGDP1), per capita personal income (CAINC1), 2024 · BEA county GDP · About this topic
Businesses opening and closing
How many workplaces with employees opened and closed each year since 1978, how many people applied to start a business, and how many businesses run with no employees at all.
- workplaces opened in 2023
- 187
- 174 closed
- net workplaces, 2019 to 2023
- +36
- openings minus closings
- applications to start a business, 2025
- 1,111
- +75% since 2019
- businesses with no employees, 2023
- 10,394
- +21% since 2012
A workplace here is one location with paid employees: a chain with five stores is five. An application to start a business is a request for a federal employer number, not an opening, and most applicants never hire anyone.
| Years | Opened | Closed | Net |
|---|---|---|---|
| 1978 to 1989 | 191 | 160 | +31 |
| the 1990s | 199 | 163 | +36 |
| the 2000s | 188 | 193 | -5 |
| the 2010s | 159 | 150 | +8 |
| 2020 to 2023 | 176 | 171 | +5 |
| Year | Opened | Closed | Net |
|---|---|---|---|
| 2019 | 164 | 149 | +15 |
| 2020 | 144 | 194 | -50 |
| 2021 | 162 | 155 | +7 |
| 2022 | 213 | 162 | +51 |
| 2023 | 187 | 174 | +13 |
Source: U.S. Census Bureau: Business Dynamics Statistics 1978-2023; Business Formation Statistics, county business applications 2005-2025; Nonemployer Statistics 2012-2023 · Census Business Dynamics Statistics · Census Business Formation Statistics, counties · Census Nonemployer Statistics · About this topic
Federal money
What the federal government obligated to the county in fiscal 2025, by county of performance; Social Security, Medicare and most benefits are not counted.
- in federal contracts performed in the county, fiscal 2025
- $29 million
- $249 a resident
- in federal grants, fiscal 2025
- $150 million
- $1,283 a resident
- in federal loans and loan guarantees
- -$62,061
- in direct federal payments to people and organizations
- $638 million
Source: USAspending federal awards by county of performance, fiscal 2025 · USAspending · About this topic
Health rankings
County Health Rankings 2025 measures for the county, with the Ohio figure alongside.
- life expectancy at birth
- 75.8 years
- Ohio 75.2
- years of life lost before 75, per 100,000 (premature death)
- 8,918
- Ohio 9,740
- population health group among U.S. counties
- 4 of 10
- 1 is healthiest
- community conditions group among U.S. counties
- 4 of 10
- 1 is best
- of children in poverty
- 11.6%
- Ohio 17.5%
- uninsured
- 12.6%
- Ohio 7.1%
No community water system in the county had a health-based drinking water violation in the rankings' reporting year.
| Measure | Wayne County | Ohio |
|---|---|---|
| Life expectancy at birth (years) | 75.8 | 75.2 |
| Years of potential life lost before 75, per 100,000 (premature death) | 8,918 | 9,740 |
| Adults in fair or poor health | 18.2% | 17.9% |
| Uninsured | 12.6% | 7.1% |
| Children in poverty | 11.6% | 17.5% |
| Median household income | $69,834 | $67,873 |
| Income inequality (80th to 20th percentile household income ratio) | 3.8 | 4.6 |
| Households with severe housing problems | 11.9% | 12.7% |
| People per primary care physician | 2,012 | 1,328 |
| People per mental health provider | 247 | 286 |
| People per dentist | 2,045 | 1,535 |
| Preventable hospital stays per 100,000 Medicare enrollees | 2,264 | 3,033 |
| Medicare enrollees with a flu vaccination | 48% | 51% |
| Injury deaths per 100,000 | 93.5 | 100.7 |
| Suicides per 100,000 | 14.1 | 14.7 |
| Child deaths per 100,000 (under 18) | 63.0 | 59.2 |
| Infant deaths per 1,000 live births | 6.9 | 7.0 |
| Teen births per 1,000 females 15 to 19 | 10.8 | 17.4 |
| Average daily fine-particle pollution (PM2.5, µg/m³) | 8.4 | 7.8 |
| Any drinking water violation in the county | No | |
| Population used by the rankings | 116,510 | |
| Population health group (1 to 10 among U.S. counties; 1 is healthiest) | 4 | |
| Community conditions group (1 to 10 among U.S. counties; 1 is best) | 4 |
Source: County Health Rankings & Roadmaps 2025 (University of Wisconsin Population Health Institute) · County Health Rankings · About this topic
Cancer
New cancers and cancer deaths per 100,000 people, age-adjusted, from the National Cancer Institute's State Cancer Profiles.
- new cancers a year per 100,000 people, age-adjusted, 2018 to 2022
- 446.6
- 95% confidence interval 431.0 to 462.6 · Ohio 472.9 · U.S. 448.6
- cases a year
- 671
- incidence trend
- stable
- cancer deaths a year per 100,000, age-adjusted, 2019 to 2023
- 155.1
- Ohio 160.3 · U.S. 145.4
- cancer deaths a year
- 245
- death-rate trend
- falling
- -1.2% a year
| Site | Per 100,000 | Ohio | Cases a year | Trend |
|---|---|---|---|---|
| Lung | 57.2 | 63.6 | 92 | falling |
| Colorectal | 39.9 | 38.4 | 58 | stable |
| Female breast | 122.7 | 133.0 | 92 | stable |
| Prostate | 108.7 | 120.8 | 87 | stable |
| Leukemia | 11.1 | 13.0 | 16 | stable |
| Bladder | 20.4 | 21.8 | 32 | stable |
Source: NCI State Cancer Profiles, county incidence 2018-2022 and mortality 2019-2023 · NCI cancer profiles · About this topic
Drug overdoses
Provisional overdose death counts by county from the CDC, 12 months at a time.
- overdose deaths in the 12 months ending December 2025
- 13
- CDC provisional count
- deaths per 100,000 residents
- 11.2
- Ohio 20.8
- highest 12-month total since 2020
- 43
- 12 months ending May 2022
Source: CDC NCHS provisional county drug overdose deaths, 12-month-ending counts; CDC VSRR for the Ohio row · CDC overdose data · About this topic
Medicare
Who in the county is on Medicare and how they are covered, from CMS enrollment counts.
- people on Medicare, 2025
- 26,093
- 22% of residents
- aged 65 or over
- 23,660
- younger people with disabilities
- 2,433
- chose a Medicare Advantage plan
- 56%
- also on Medicaid
- 12.2%
- with Part D drug coverage
- 86.1%
- enrollment since 2020
- +9.5%
- 23,824 enrollees then
Source: CMS Medicare Monthly Enrollment by county, 2025 · CMS Medicare Monthly Enrollment · About this topic
Severe weather
Hail, wind, flooding and tornado reports logged for the county in NOAA's Storm Events database.
- severe weather reports, 2016 to 2026
- 97
- NOAA Storm Events log
- in reported damage
- $10 million
- largest hail
- 2 in
- March 30, 2017
The costliest event was flash floods on July 21, 2019, $8 million in damage. Rainfall estimated around 2 to 5 inches caused substantial damage in flash floods across central Wayne County. Preliminary damage assessments reported at least…
| Kind | Reports |
|---|---|
| damaging thunderstorm wind | 70 |
| hail | 12 |
| flash floods | 9 |
| tornadoes | 3 |
| Kind | Reports |
|---|---|
| high wind | 7 |
| winter storms | 6 |
| extreme cold | 2 |
Source: NOAA Storm Events database, 2016-2026 · NOAA storm events · About this topic
Weather warnings
Every warning, watch and advisory the National Weather Service has issued for the county since 2015.
- tornado warnings since 2015
- 19
- severe thunderstorm warnings
- 185
- flash flood warnings
- 13
- winter storm or blizzard warnings
- 9
- warnings, watches and advisories in all
- 829
| Product | Count |
|---|---|
| Tornado Warning | 19 |
| Tornado Watch | 12 |
| Severe Thunderstorm Warning | 185 |
| Flash Flood Warning | 13 |
| Flood Warning | 45 |
| Areal Flood Warning | 15 |
| Areal Flood Advisory | 64 |
| Winter Storm Warning | 9 |
| Winter Weather Advisory | 63 |
| Excessive Heat Warning | 3 |
| Heat Advisory | 19 |
| Extreme Cold Warning | 2 |
| Wind Chill Warning | 4 |
| Snow Squall Warning | 6 |
| Year | Warnings |
|---|---|
| 2017 | 1 |
| 2019 | 2 |
| 2020 | 1 |
| 2021 | 2 |
| 2022 | 2 |
| 2023 | 5 |
| 2024 | 1 |
| 2025 | 4 |
| 2026 | 1 |
Source: National Weather Service warnings/watches/advisories, Iowa Environmental Mesonet VTEC archive, since 2015 · IEM warning archive · About this topic
Drought
How often the U.S. Drought Monitor has put the county in drought since 2000.
- weeks in moderate drought or worse since 2020
- 23
- of them severe or worse
- 0
- weeks at least abnormally dry since 2020
- 94
- of all weeks since 2000 in drought
- 5%
The worst reading since 2000 was severe drought in September 2002.
As of September 1, 2026: no drought.
Source: U.S. Drought Monitor weekly county statistics, 2000-2026 · U.S. Drought Monitor · About this topic
The long-run climate
Average temperature and precipitation over the whole county since 1895, from NOAA's county climate series; only complete years count.
- average year, 1996 to 2025
- 50.7 °F
- 48.6 °F in 1901 to 1930 · 48.7 °F in 1951 to 1980
- change since 1901 to 1930
- +2.1 °F
- warmest year since 1895
- 2024
- 53.9 °F
- precipitation in the average year, 1996 to 2025
- 40.2 in
- 36.4 in 1901 to 1930 (+10.5%)
- wettest year since 1895
- 2011
- 54.1 inches
- average temperature, 2025
- 50.2 °F
- 36.0 inches of precipitation
Source: NOAA nClimDiv county monthly temperature and precipitation, 1895-2026 (climdiv-tmpccy / climdiv-pcpncy) · NOAA climate at a glance · About this topic
Hazard mitigation
FEMA-funded projects in the county that reduce future flood, storm and other losses: buyouts, plans, studies and equipment.
- hazard mitigation projects since 2004
- 5
- FEMA grants, program years 2004 to 2019
- total project worth
- $2 million
- $1 million federal
- properties covered
- 28
Largest: Acquisition of Private Real Property (Structures and Land) - Riverine; 200.5: Acquisition of Vacant Land for Wayne (County), $1 million (fiscal 2019).
| Project type | Projects |
|---|---|
| Local Multijurisdictional Multihazard Mitigation Plan - UPDATE | 1 |
| Acquisition of Private Real Property (Structures and Land) - Riverine; 200.5: Acquisition of Vacant Land | 1 |
| Advance Assistance (FMA and PDMC) | 1 |
Source: OpenFEMA Hazard Mitigation Assistance projects, v4 API · OpenFEMA · About this topic
Air toxics
The EPA's modeled lifetime cancer risk from outdoor air toxics across the county.
- lifetime cancer risk from outdoor air toxics
- 20 in a million
- EPA AirToxScreen 2020
Mostly formaldehyde (16 in a million) and carbon tetrachloride (2.9 in a million).
Source: EPA AirToxScreen 2020 · EPA AirToxScreen · About this topic
Water use
The 2015 figures are the U.S. Geological Survey's last county estimate, made a different way; the two are not a trend.
- million gallons of fresh water withdrawn a day, 2015 (USGS estimate)
- 15.8
- people served by public water systems, 2015
- 60,400
- 71 gallons a person a day used at home
- people supplying their own water at home, 2015
- 55,700
| Use | Million gallons a day |
|---|---|
| All uses | 15.8 |
| Public water systems | 8.1 |
| Power plants (thermoelectric) | 0.1 |
| Industry (own supply) | 1.3 |
| Irrigation | 0.2 |
| Mining | 0.0 |
| Livestock | 1.9 |
| Fish farms (aquaculture) | 0.1 |
Source: USGS 2015 county water-use census (Dieter and others 2018) · ODNR Water Withdrawal Atlas (archived copy) · USGS county water use 2015 · About this topic
Fluoridated water
The share of county residents on community water whose water is fluoridated, from the Ohio Department of Health.
- of residents on community water receive fluoridated water
- 28.4%
Source: Ohio Department of Health county fluoridation profiles (DataOhio) · ODH fluoridation report (DataOhio) · EPA SDWIS search · About this topic
Firefighting foam (PFAS)
PFAS-based aqueous film-forming foam registered in the county with Ohio EPA, which is collecting it for disposal so it is never sprayed again.
- fire departments or other holders registered
- 7
- of PFAS-based AFFF foam registered with Ohio EPA
- 891 gal
- in sealed containers
- 695 gal
- in opened containers
- 190 gal
Source: Ohio EPA AFFF firefighting-foam inventory · Ohio EPA PFAS · About this topic
Road salt grants
H2Ohio pays for brine makers, calibrated spreaders and covered salt barns so less chloride reaches streams and wells.
- H2Ohio chloride-reduction grant awarded in the county
- 1
Source: Ohio EPA H2Ohio chloride reduction grants · Ohio EPA chloride reduction grants · About this topic
Farms
The county's farms in the 2022 Census of Agriculture. A dash means NASS published no figure: withheld to protect individual farms, or none reported.
- farms, 2022
- 2,084
- 124 acres to a farm on average
- acres in farms
- 259,339
- 199,017 acres of cropland
- of the county's land is cropland
- 55.8%
- farm products sold, 2022
- $554 million
- 74% from livestock, poultry and their products
| Crop or animal | Acres or head |
|---|---|
| Corn for grain (acres harvested) | 60,714 |
| Soybeans (acres harvested) | 51,408 |
| Irrigated land (acres) | 1,024 |
| Cattle and calves | 75,190 |
| Hogs and pigs | 33,392 |
| Egg-laying chickens | 620,297 |
| Broilers and other meat chickens | 4,367,083 |
| Turkeys | 195 |
Source: USDA NASS 2022 Census of Agriculture county totals (Quick Stats bulk file) · USDA Census of Agriculture · NASS 2022 county profile · About this topic
Farm pesticides
Pesticides applied on the county's farms in 2018 as estimated by the U.S. Geological Survey, in kilograms of active ingredient.
- of pesticide active ingredient used on farms, 2018
- 131,386 kg
- USGS estimate (preliminary, high estimate)
- per square mile of land
- 235.8 kg
- 42nd of Ohio's 88 counties, most per square mile first
- atrazine
- 15,193 kg
- glyphosate
- 59,011 kg
- compounds with an estimate
- 148
| Compound | Kilograms |
|---|---|
| glyphosate | 59,011 |
| atrazine | 15,193 |
| metolachlor | 14,774 |
| acetochlor | 9,602 |
| glufosinate | 3,684 |
Source: USGS preliminary county agricultural pesticide-use estimates, 2018 (high estimate) · USGS county pesticide-use estimates, 2018 · About this topic
Rail accidents
Accidents railroads reported to the Federal Railroad Administration in the county since 2010. Yard mishaps at walking speed dominate; main-line derailments are the rare, dangerous ones.
- rail equipment accidents since 2010
- 5
- FRA Form 54
- derailments
- 2
Source: FRA Form 54 rail equipment accident reports, county fallback for railAccidentLine() · FRA rail equipment accidents (Form 54) · About this topic
House records
Where the house-by-house records on this county's ZIP pages come from, and how current they are.
- parcel records placed on the map
- 40,646
- snapshot of September 15, 2026
Wayne County Auditor (Wooster): parcel, dwelling-card and sales layers published by the Auditor GIS Division.
Office: Wayne County Auditor, GIS Division, Wooster, Ohio.
These are full appraisal records: every house's year built, value and sales history opens from its ZIP page.
Source: Wayne County Auditor (Wooster): parcel, dwelling-card and sales layers published by the Auditor GIS Division, snapshot 2026-09-15 · Wayne County Auditor · About this topic
What stands out
Where this county sits among Ohio's 88 on the measures the atlas tracks, and the sentences the inference engine built from them. Rankings and associations only: nothing here says one measure causes another, and a county-level pattern is not a fact about anyone who lives here.
- measures flagged for this county
- 6
- 6 in the worst tenth of the 88
- of the 85 counties with anything flagged
- 51st worst
- economy, health
- losing ground on Ohio
- 1
- the gap to the state is widening
- peer group the engine compares it against
- small metro and micropolitan
"Losing ground on Ohio" compares trends, not levels: a county can be losing ground while its own number improves, if the rest of the state improved faster over the same years.
Wayne County has Ohio's highest number of farms: 2,084 farms (2022). Source: USDA NASS.
Wayne County's share of GDP from professional and business services rose from 3.4% in 2015 to 7.5% in 2024, a change of +122%, the 3rd steepest rise among the 73 Ohio counties with the data. Source: U.S. Bureau of Economic Analysis.
Wayne County has the 2nd-highest uninsured share of the population of Ohio's 88 counties: 12.6% (2025). Source: University of Wisconsin Population Health Institute / RWJF.
Across Ohio, share of adults with housing insecurity in the past year and votes cast for Auditor of State per 10,000 residents move in opposite directions. Wayne County is an exception: its votes cast for Auditor of State per 10,000 residents is 3,267.5 (2022), far lower than the statewide pattern predicts from its share of adults with housing insecurity in the past year of 9.9% (2025). Sources: CDC; OpenElections.
Wayne County's TRI on-site releases fell from 694,890 pounds in 2015 to 75,925 pounds in 2024, a change of -89%, the 5th steepest fall among the 85 Ohio counties with the data. Source: U.S. EPA.
Wayne County's uninsured rate, all ages rose from 10.4% in 2015 to 13.4% in 2024, a change of +29%, the 3rd steepest rise among the 88 Ohio counties with the data. Source: U.S. Census Bureau.
Wayne County is among Ohio's ten lowest for share of children in single-parent households (10.6%, 2025) and among the ten lowest for total housing units per 10,000 residents (3,982.4, 2020), two measures that move together across the state (rank correlation 0.75 with population held fixed). Sources: University of Wisconsin Population Health Institute / RWJF; U.S. Census Bureau.
Wayne County has the 2nd-lowest share of adults sleeping less than seven hours of Ohio's 88 counties: 32.7% (2025). Source: CDC.
| Measure | Latest | Ohio median | Rank, worst first | Change |
|---|---|---|---|---|
| Uninsured rate, all ages (SAHIE) | 13.4% (2024) | 7.9% | 2nd of 88 | 13.4% from 10.4% since 2015 · losing ground on Ohio |
| Net migration (IRS returns) | -443 (2022) | 51.5 | 5th of 88 | |
| Share of women 65 and over up to date on preventive care | 31.7% (2023) | 35.5% | 9th of 88 | |
| Share of adults who binge drink | 20.0% (2025) | 18.3% | 3rd of 88 | |
| High school completion (County Health Rankings) | 86.3% (2025) | 91.3% | 9th of 88 | |
| Share of adults with high blood pressure taking medicine for it | 59.3% (2025) | 60.7% | 7th of 88 |
Source: Cracked Buckeye inference engine (scripts/inference) over the county-year panel, run 2026-09-21 · What moves with what across Ohio
Places
The 33 cities, villages and townships whose residents live mostly in Wayne County, with the population of each.
Cities 3
Villages 12
Townships 18
- Chippewa Township6,740
- East Union Township5,758
- Sugar Creek Township5,247
- Salt Creek Township4,685
- Wooster Township4,612
- Franklin Township4,235
- Salt Creek Township4,133
- Wayne Township3,982
- Jackson Township3,574
- Green Township3,475
- Paint Township3,300
- Plain Township3,069
- Chester Township3,043
- Baughman Township3,006
- Milton Township2,964
- Congress Township2,860
- Canaan Township2,779
- Clinton Township1,668
ZIP codes
The 15 ZIP codes whose residents live mostly in Wayne County, largest first. Each links to its own page; the water system column links to the utility serving most of its residents.
| ZIP | Name | Residents | Water system | Radon | Home value | School district | Flood |
|---|---|---|---|---|---|---|---|
| 44691 | Wooster | 44,666 | Wooster City 60% Groundwater (wells) |
7.3 pCi/L average radon | Median home $230,300 | Wooster City 4.5 stars overall | 1.8% of residents in the 1% floodplain |
| 44667 | Orrville | 13,723 | Orrville City 63% Groundwater (wells) |
5.2 pCi/L average radon | Median home $208,600 | Orrville City 3.5 stars overall | 0.7% of residents in the 1% floodplain |
| 44270 | Rittman | 8,384 | Rittman City 72% Groundwater (wells) |
3.7 pCi/L average radon | Median home $170,200 | Rittman Exempted Village 4.5 stars overall | 9.0% of residents in the 1% floodplain |
| 44606 | East Union Township and Apple Creek | 8,218 | Apple Creek Village 15% Mostly private wells |
6.9 pCi/L average radon | Median home $288,000 | Southeast Local 4.5 stars overall | 2.7% of residents in the 1% floodplain |
| 44230 | Chippewa Township and Doylestown | 8,064 | Doylestown Village 38% Mostly private wells |
4.9 pCi/L average radon | Median home $229,000 | Chippewa Local 4 stars overall | 1.0% of residents in the 1% floodplain |
| 44627 | Salt Creek Township and Fredericksburg | 7,692 | Fredericksburg Village 7% Mostly private wells |
13.0 pCi/L average radon | Median home $335,000 | Southeast Local 4.5 stars overall | 1.2% of residents in the 1% floodplain |
| 44287 | Jackson Township and West Salem | 7,561 | Rural Lorain Co. Water A 25% Mostly private wells |
4.1 pCi/L average radon | Median home $194,500 | Northwestern Local 4 stars overall | 1.0% of residents in the 1% floodplain |
| 44618 | Sugar Creek Township and Dalton | 7,159 | Dalton Village 27% Mostly private wells |
4.3 pCi/L average radon | Median home $248,800 | Dalton Local 4.5 stars overall | 0.3% of residents in the 1% floodplain |
| 44676 | Shreve | 4,771 | Shreve Village 31% Mostly private wells |
9.0 pCi/L average radon | Median home $180,000 | Triway Local 4 stars overall | 4.2% of residents in the 1% floodplain |
| 44217 | Creston | 4,165 | Creston Village 51% Groundwater (wells) |
7.2 pCi/L average radon | Median home $199,200 | North Central Local 4 stars overall | 6.9% of residents in the 1% floodplain |
| 44677 | Smithville | 2,805 | Smithville Village 43% Mostly private wells |
5.3 pCi/L average radon | Median home $230,600 | Green Local 4.5 stars overall | 2.8% of residents in the 1% floodplain |
| 44645 | Chippewa Township and Marshallville | 2,670 | Marshallville Village 32% Mostly private wells |
4.3 pCi/L average radon | Median home $230,400 | Green Local 4.5 stars overall | 1.7% of residents in the 1% floodplain |
| 44214 | Canaan Township and Burbank | 2,149 | no mapped system | 5.1 pCi/L average radon | Median home $237,800 | North Central Local 4 stars overall | 7.6% of residents in the 1% floodplain |
| 44276 | Milton Township and Sterling | 2,023 | no mapped system | 3.7 pCi/L average radon | Median home $231,300 | North Central Local 4 stars overall | 19% of residents in the 1% floodplain |
| 44659 | Mount Eaton | 160 | Mount Eaton Village 100% Groundwater (wells) |
Too few radon tests | Median home $156,700 | Southeast Local 4.5 stars overall | 0.0% of residents in the 1% floodplain |
Source: residents: 2020 Census (POP100, ZCTA) · water systems: EPA SDWIS + service-area-boundary join · radon: Ohio Department of Health radon test results by ZIP since 2010 · home value: Census ACS 2020-2024 5-year by ZCTA (housing/commute tables) · school districts: Ohio school district boundaries (OGRIP via ODOT) · flood: FEMA National Flood Hazard Layer.
On the map
Open the map fitted to Wayne County. Every ZIP code in the table above links to its page, and each page opens the map at that ZIP.
Historic places: 17 National Register listings in Wayne County. See every one on the map, each with its record and its National Park Service file.
Rankings within the county
The county's ZIP codes ranked by what the map measures; each heading links to the topic's page.
Local government
Who holds office in Wayne County, how its elections and ballot issues came out, and the state auditor's record.
Who holds office
| Office | Name | Party | Term ends | Contact |
|---|---|---|---|---|
| Commissioner | Jonathan Hofstetter | · website | ||
| Commissioner | Dave McMillen | · website | ||
| Commissioner | Matt Martin | · website | ||
| Auditor | Russell Robertson | (330) 287-5430 · auditor@co.wayne.oh.us 428 West Liberty Street, Wooster, Ohio 44691 · website | ||
| Coroner | Dr. Amy S. Jolliff | (330) 345-5891 · website | ||
| Engineer | Scott Miller | (330) 287-5500 3151 West Old Lincoln Way, Wooster, Ohio 44691 · website | ||
| Prosecuting Attorney | Angela Wypasek | (330) 262-3030 2015 West Liberty Street, Wooster, Ohio 44691 · website | ||
| Recorder | Jane Carmichael | (330) 287-5460 428 West Liberty Street, Wooster, Ohio 44691 · website | ||
| Sheriff | Thomas Ballinger | (330) 287-5750 201 West North Street, Wooster, Ohio 44691 · website | ||
| Treasurer | Melissa Koch | (330) 287-5450 428 West Liberty Street, Wooster, Ohio 44691 · website |
Roster as of 2026-09-17: county board of elections.
Auditor of State record
- No fiscal caution, watch or emergency on the Auditor of State's lists.
- Financial Health Indicators (the Auditor of State's 17 measures; critical / cautionary / positive): 2020 0 / 1 / 16; 2021 0 / 3 / 14; 2022 0 / 4 / 13; 2023 0 / 1 / 16; 2024 0 / 3 / 14; 2025 0 / 1 / 16.
- Financial Audit, 2025, released 2026-07-14
- Financial Audit, 2024, released 2025-07-15
- Financial Audit, 2023, released 2024-07-25
Townships and villages without a page of their own
Greene Township
Auditor of State record
- No fiscal caution, watch or emergency on the Auditor of State's lists.
- Agreed Upon Procedures, 2024 to 2025, released 2026-09-01
School districts
Beacon Hill Community School
Auditor of State record
- No fiscal caution, watch or emergency on the Auditor of State's lists.
- Financial Audit, 2023 to 2024, released 2025-03-18
Chippewa Local School District
Auditor of State record
- No fiscal caution, watch or emergency on the Auditor of State's lists.
- Financial Audit, 2023 to 2024, released 2025-02-20
Dalton Local School District
Auditor of State record
- No fiscal caution, watch or emergency on the Auditor of State's lists.
- Financial Audit, 2024 to 2025, released 2026-03-24
- Financial Audit, 2023 to 2024, released 2025-02-18
Green Local School District
Auditor of State record
- No fiscal caution, watch or emergency on the Auditor of State's lists.
- Financial Audit, 2024 to 2025, released 2026-03-31
- Financial Audit, 2023 to 2024, released 2024-12-03
Liberty Preparatory School
Auditor of State record
- No fiscal caution, watch or emergency on the Auditor of State's lists.
- Financial Audit, 2024 to 2025, released 2026-05-07
- Financial Audit, 2023 to 2024, released 2025-05-08
Northwestern Local School District
Auditor of State record
- No fiscal caution, watch or emergency on the Auditor of State's lists.
- Financial Audit, 2022 to 2023, released 2026-08-11
Norwayne Local School District
Auditor of State record
- No fiscal caution, watch or emergency on the Auditor of State's lists.
- Financial Audit, 2024 to 2025, released 2026-04-21
- Financial Audit, 2023 to 2024, released 2025-01-28
Orrville City School District
Auditor of State record
- No fiscal caution, watch or emergency on the Auditor of State's lists.
- Financial Audit, 2024 to 2025, released 2026-03-31
- Financial Audit, 2023 to 2024, released 2025-01-14
Rittman Exempted Village School District
Auditor of State record
- No fiscal caution, watch or emergency on the Auditor of State's lists.
- Financial Audit, 2024 to 2025, released 2026-04-21
- Financial Audit, 2023 to 2024, released 2024-12-26
Southeast Local School District
Auditor of State record
- No fiscal caution, watch or emergency on the Auditor of State's lists.
- Financial Audit, 2023 to 2024, released 2025-02-04
Triway Local School District
Auditor of State record
- No fiscal caution, watch or emergency on the Auditor of State's lists.
- Financial Audit, 2024 to 2025, released 2026-04-07
- Financial Audit, 2023 to 2024, released 2025-03-25
Wayne County Schools Career Center
Auditor of State record
- No fiscal caution, watch or emergency on the Auditor of State's lists.
- Financial Audit, 2024 to 2025, released 2026-04-07
- Financial Audit, 2023 to 2024, released 2025-03-04
Waynedale Local School District
Auditor of State record
- No fiscal caution, watch or emergency on the Auditor of State's lists.
- Financial Audit, 2024 to 2025, released 2026-03-31
Wooster City School District
Auditor of State record
- No fiscal caution, watch or emergency on the Auditor of State's lists.
- Financial Audit, 2024 to 2025, released 2026-03-31
- Financial Audit, 2023 to 2024, released 2025-02-27
Courts, districts and other bodies
31st Senate District
Elections for office
| Date | Office | Candidates and votes |
|---|---|---|
| 2024-03-19 | Member of State Central (this county's part) | Charles Blake (Republican) 11,316, 37.09%; Douglas S. Wills (Republican) 19,190, 62.91% |
| 2024-03-19 | Committee, Woman (this county's part) | Antonia J. Blake (Republican) 7,888, 25.65%; Kathy Kimble (Republican) 22,869, 74.35% |
Winners in bold. Results from the county board of elections' official canvass unless marked.
Northwestern LSD
Elections for office
| Date | Office | Candidates and votes |
|---|---|---|
| 2025-11-04 | Member, Board of Education (this county's part) | Reggie Kline 741, 100.0% |
| 2023-11-07 | Board Member (this county's part) (number of seats not on file, so winners are not marked) | Rick Ellerbrock 1,584, 31.76%; John H. Smith 1,572, 31.52%; Brad Stull 1,832, 36.73% |
Winners in bold. Results from the county board of elections' official canvass unless marked.
Norwayne LSD: 1 of 1 money issues passed since 2025
Money issues on the ballot since 2025: 1 of 1 passed.
Ballot issues
| Date | Issue | For | Against | Result |
|---|---|---|---|---|
| 2025-05-06 | Issue: None (2.0 mills, renewal) | 293 | 194 | Passed (60.16% for) |
Elections for office
| Date | Office | Candidates and votes |
|---|---|---|
| 2025-11-04 | Member, Board of Education (this county's part) | Rachael Ramsier 986, 95.82%; Eric Graham 43, 4.18% |
| 2023-11-07 | Board Member (this county's part) (number of seats not on file, so winners are not marked) | Kirk W. Gasser 2,088, 53.32%; Doug Ingold 1,740, 44.43%; Angie Smith 88, 2.25% |
Winners in bold. Results from the county board of elections' official canvass unless marked.
Rittman EVSD
Elections for office
| Date | Office | Candidates and votes |
|---|---|---|
| 2025-11-04 | Member, Board of Education (this county's part) | Andrew Baillis 618, 15.89%; Caleb Beery 1,069, 27.49%; Karen S. Beery 801, 20.6%; Craig Beltz 427, 10.98%; Joshua Carey 632, 16.25%; Donald D. Truex 342, 8.79% |
| 2023-11-07 | Board Member (this county's part) | Lona Renee Busic 1,343, 48.57%; Douglas G. Stewart 1,422, 51.43% |
Winners in bold. Results from the county board of elections' official canvass unless marked.
Southeast LSD
Elections for office
| Date | Office | Candidates and votes |
|---|---|---|
| 2023-11-07 | Board Member (this county's part) (number of seats not on file, so winners are not marked) | Sandra Cerniglia 1,019, 15.29%; Brian R. Miller 1,676, 25.15%; Rick Reynolds 1,201, 18.02%; Cheryl J. Steiner 1,109, 16.64%; David D. Troyer 1,660, 24.91% |
Winners in bold. Results from the county board of elections' official canvass unless marked.
Tri-County ESC Dist 2
Elections for office
| Date | Office | Candidates and votes |
|---|---|---|
| 2023-11-07 | Board Member (this county's part) | Nathan Stutz 2,552, 100.0% |
Winners in bold. Results from the county board of elections' official canvass unless marked.
Tri-County ESC Dist 3
Elections for office
| Date | Office | Candidates and votes |
|---|---|---|
| 2023-11-07 | Board Member (this county's part) | R. Willard Welch 4,047, 100.0% |
Winners in bold. Results from the county board of elections' official canvass unless marked.
Tri-County ESC Dist 4
Elections for office
| Date | Office | Candidates and votes |
|---|---|---|
| 2023-11-07 | Board Member (this county's part) | James Bargar 3,759, 100.0% |
Winners in bold. Results from the county board of elections' official canvass unless marked.
Tri-County ESC Dist 5
Elections for office
| Date | Office | Candidates and votes |
|---|---|---|
| 2023-11-07 | Board Member (this county's part) | Ann L. Tschantz 3,404, 100.0% |
Winners in bold. Results from the county board of elections' official canvass unless marked.
Tri-County ESC Dist 7
Elections for office
| Date | Office | Candidates and votes |
|---|---|---|
| 2023-11-07 | Board Member (this county's part) | Earl Rhamy 2,289, 100.0% |
Winners in bold. Results from the county board of elections' official canvass unless marked.
Tri-County ESC Dist 8
Elections for office
| Date | Office | Candidates and votes |
|---|---|---|
| 2023-11-07 | Board Member (this county's part) | No Valid Candidate Filed 0 |
Winners in bold. Results from the county board of elections' official canvass unless marked.
Tri-County ESC Dist 9
Elections for office
| Date | Office | Candidates and votes |
|---|---|---|
| 2023-11-07 | Board Member (this county's part) | John B. Burkey 1,579, 100.0% |
Winners in bold. Results from the county board of elections' official canvass unless marked.
Tri-County ESC District 2
Elections for office
| Date | Office | Candidates and votes |
|---|---|---|
| 2025-11-04 | and Type: General Service Center (this county's part) | Nathan Stutz 844, 100.0% |
Winners in bold. Results from the county board of elections' official canvass unless marked.
Tri-County ESC District 4
Elections for office
| Date | Office | Candidates and votes |
|---|---|---|
| 2025-11-04 | and Type: General Service Center (this county's part) | Ryan Fickes 1,780, 100.0% |
Winners in bold. Results from the county board of elections' official canvass unless marked.
Tri-County ESC District 8
Elections for office
| Date | Office | Candidates and votes |
|---|---|---|
| 2025-11-04 | and Type: General Service Center (this county's part) | No Valid Candidate Filed 0 |
Winners in bold. Results from the county board of elections' official canvass unless marked.
Triway LSD: 0 of 1 money issues passed since 2023
Money issues on the ballot since 2023: 0 of 1 passed.
Ballot issues
| Date | Issue | For | Against | Result |
|---|---|---|---|---|
| 2023-05-02 | Issue: None (2.8 mills, renewal) | 406 | 497 | Failed (44.96% for) |
Elections for office
| Date | Office | Candidates and votes |
|---|---|---|
| 2025-11-04 | Member, Board of Education (this county's part) | Aaron Boothby 1,141, 35.12%; Christine Bricker 1,101, 33.89%; Anjanette James 1,007, 30.99% |
| 2023-11-07 | Board Member (this county's part) (number of seats not on file, so winners are not marked) | Tyler Bishko 1,329, 19.77%; Angie Giltner 1,650, 24.55%; Carrie Perkins 1,647, 24.51%; Travis Snyder 2,095, 31.17% |
Winners in bold. Results from the county board of elections' official canvass unless marked.
Wayne County
Who holds office
| Office | Name | Party | Term ends | Contact |
|---|---|---|---|---|
| Clerk of Courts | Scott Wiggam | (330) 287-5590 107 West Liberty Street, Wooster, Ohio 44691 · website | ||
| Common Pleas Judge | Corey Spitler | 107 West Liberty Street, Public Square, Wooster, Ohio 44691 | ||
| Common Pleas Judge | Timothy R. VanSickle | 107 West Liberty Street, Public Square, Wooster, Ohio 44691 | ||
| Juvenile Court Judge | Latecia E. Wiles | (330) 287-5560 107 West Liberty Street, Public Square, Wooster, Ohio 44691 | ||
| Municipal Court Judge | Michael W. Rickett | 2015 North Grant Street, Wooster, Ohio 44691 · website | ||
| Probate Court Judge | Latecia E. Wiles | (330) 287-5575 107 West Liberty Street, Wooster, Ohio 44691 |
Roster as of 2026-09-17: county board of elections.
Waynedale LSD: 1 of 1 money issues passed since 2025
Money issues on the ballot since 2025: 1 of 1 passed.
Ballot issues
| Date | Issue | For | Against | Result |
|---|---|---|---|---|
| 2025-05-06 | Issue: None (2.7 mills, renewal) | 346 | 273 | Passed (55.9% for) |
Elections for office
| Date | Office | Candidates and votes |
|---|---|---|
| 2025-11-04 | Member, Board of Education (this county's part) | Valorie L. Lewis 838, 48.69%; Matthew J. McKelvey 883, 51.31% |
Winners in bold. Results from the county board of elections' official canvass unless marked.
How Wayne County began
Wayne County lies on land the Lenape (Delaware), Wyandot and Shawnee used and hunted until the Treaty of Fort Industry of July 4, 1805 opened the 'New Purchase' between the Greenville treaty line and the Connecticut Western Reserve; it was named for General Anthony Wayne, whose 1794 victory at Fallen Timbers led to the Greenville treaty. The first settler, William Larwill, came in 1806 with the surveying parties, John Bever, William Henry and Joseph Larwill laid out Wooster in the fall of 1808, the legislature described the county on February 13, 1808, and it was organized on March 1, 1812, with Wooster (named for the Revolutionary general David Wooster) as seat. Settlers came largely from Pennsylvania, with Virginians, a small Vermont colony and English, German and Swiss immigrants, and Amish and Mennonite congregations from the 1810s; the Pittsburgh, Fort Wayne and Chicago railroad, which Wooster's leaders campaigned for from 1845, brought new towns such as Orrville (laid out 1852). Wooster became a college and farm-science town with the Presbyterian University of Wooster (chartered 1866, opened 1870) and the Ohio Agricultural Experiment Station, which the county won from Columbus in 1891-92 with an $85,000 bond donation. Today the county is a mix of farms, Amish country and manufacturing, home to The J.M. Smucker Company in Orrville and to the Ohio Agricultural Research and Development Center, with a 2010 population of 114,520.
Wooster, laid out in the fall of 1808 by John Bever, William Henry and Joseph H. Larwill and named for Revolutionary War General David Wooster, was made the seat of justice on May 30, 1811, before the county's formal organization.
Researched 2026-10-11 · en.wikipedia.org · en.wikipedia.org · en.wikipedia.org · en.wikipedia.org. The full history, with photographs, is on the pages of the county's places.
Videos about Wayne County
Short videos we made from the old maps and records. All videos
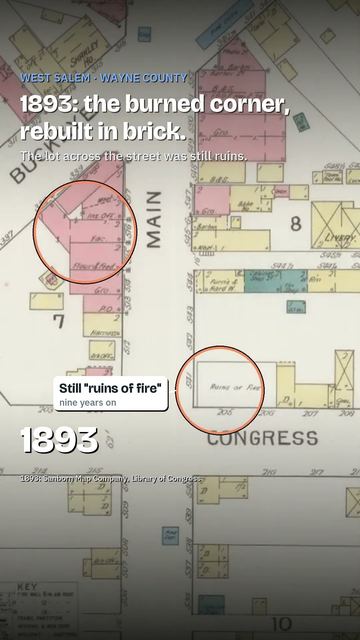
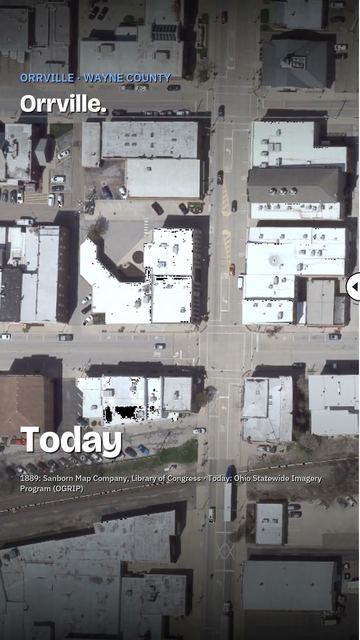
Politics
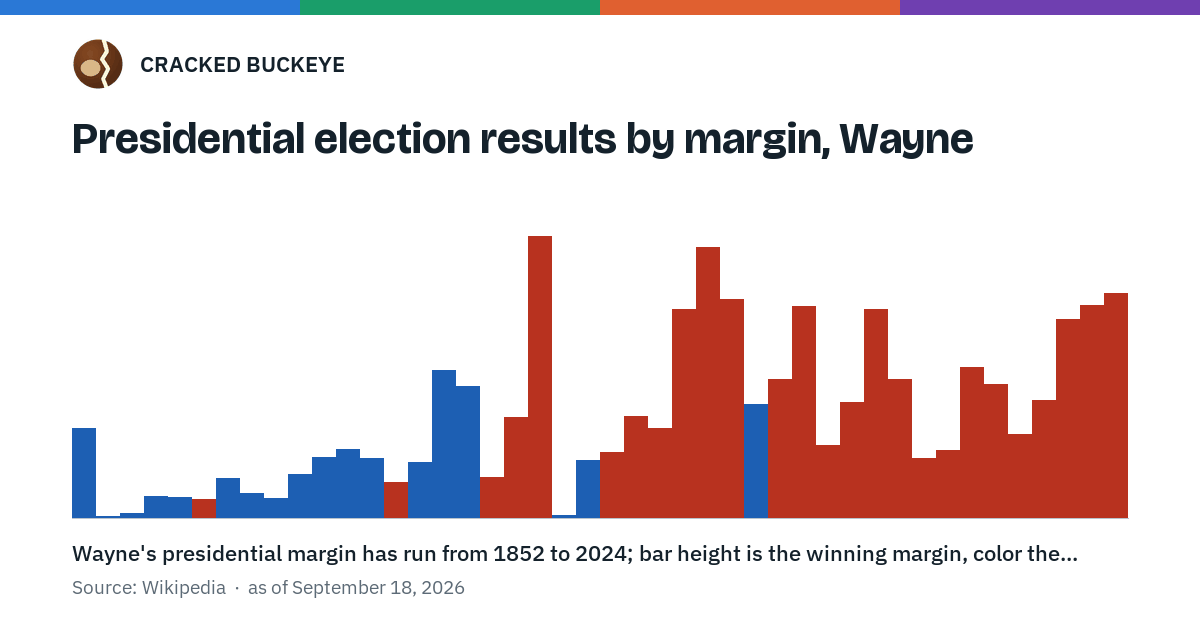
How Wayne County has voted for president since 1852, turnout since 1996, and what is on its 2026 ballot.
The numbers behind this figure, as a table
| Year | Winner | Party | Margin | Matched Ohio's winner | Matched the nation |
|---|---|---|---|---|---|
| 1852 | Franklin Pierce | D | 15.6 points | matched | matched |
| 1856 | James Buchanan | D | 0.2 points | missed | matched |
| 1860 | Stephen A. Douglas | D | 0.7 points | missed | missed |
| 1864 | George B. McClellan | D | 3.7 points | missed | missed |
| 1868 | Horatio Seymour | D | 3.5 points | missed | missed |
| 1872 | Ulysses S. Grant | R | 3.2 points | matched | matched |
| 1876 | Samuel J. Tilden | D | 6.8 points | missed | missed |
| 1880 | Winfield Scott Hancock | D | 4.3 points | missed | missed |
| 1884 | Grover Cleveland | D | 3.4 points | missed | matched |
| 1888 | Grover Cleveland | D | 7.6 points | missed | missed |
| 1892 | Grover Cleveland | D | 10.5 points | missed | matched |
| 1896 | William Jennings Bryan | D | 12.0 points | missed | missed |
| 1900 | William Jennings Bryan | D | 10.4 points | missed | missed |
| 1904 | Theodore Roosevelt | R | 6.2 points | matched | matched |
| 1908 | William Jennings Bryan | D | 9.7 points | missed | missed |
| 1912 | Woodrow Wilson | D | 25.8 points | matched | matched |
| 1916 | Woodrow Wilson | D | 22.9 points | matched | matched |
| 1920 | Warren G. Harding | R | 7.0 points | matched | matched |
| 1924 | Calvin Coolidge | R | 17.5 points | matched | matched |
| 1928 | Herbert Hoover | R | 49.2 points | matched | matched |
| 1932 | Franklin D. Roosevelt | D | 0.4 points | matched | matched |
| 1936 | Franklin D. Roosevelt | D | 10.0 points | matched | matched |
| 1940 | Wendell Willkie | R | 11.4 points | missed | missed |
| 1944 | Thomas E. Dewey | R | 17.8 points | matched | missed |
| 1948 | Thomas E. Dewey | R | 15.6 points | missed | missed |
| 1952 | Dwight D. Eisenhower | R | 36.5 points | matched | matched |
| 1956 | Dwight D. Eisenhower | R | 47.2 points | matched | matched |
| 1960 | Richard Nixon | R | 38.2 points | matched | missed |
| 1964 | Lyndon B. Johnson | D | 19.9 points | matched | matched |
| 1968 | Richard Nixon | R | 24.1 points | matched | matched |
| 1972 | Richard Nixon | R | 36.9 points | matched | matched |
| 1976 | Gerald Ford | R | 12.7 points | missed | missed |
| 1980 | Ronald Reagan | R | 20.1 points | matched | matched |
| 1984 | Ronald Reagan | R | 36.4 points | matched | matched |
| 1988 | George H.W. Bush | R | 24.2 points | matched | matched |
| 1992 | George H.W. Bush | R | 10.5 points | missed | missed |
| 1996 | Robert Dole | R | 11.8 points | missed | missed |
| 2000 | George W. Bush | R | 26.2 points | matched | matched |
| 2004 | George W. Bush | R | 23.3 points | matched | matched |
| 2008 | John McCain | R | 14.6 points | missed | missed |
| 2012 | Mitt Romney | R | 20.5 points | missed | missed |
| 2016 | Donald Trump | R | 34.6 points | matched | matched |
| 2020 | Donald J Trump | R | 37.0 points | matched | missed |
| 2024 | Donald J Trump | R | 39.3 points | matched | matched |
Every presidential election in Wayne County, year by year: its record with Ohio and the nation, closest and widest results, biggest swings, and where it has ranked among the 88.
| Year | Registered | Ballots cast | Turnout |
|---|---|---|---|
| 1996 | 57,513 | 41,403 | 71.99% |
| 2000 | 62,395 | 43,151 | 69.16% |
| 2004 | 69,810 | 52,695 | 75.48% |
| 2008 | 73,217 | 52,894 | 72.24% |
| 2012 | 77,698 | 51,562 | 66.36% |
| 2016 | 74,772 | 50,845 | 68.0% |
| 2020 | 74,470 | 54,848 | 73.65% |
| 2024 | 70,625 | 53,865 | 76.27% |
On the 2026 ballot in Wayne County:
- Attorney General of Ohio
- Auditor of State of Ohio
- Governor of Ohio
- Justice of the Supreme Court (Full term commencing 1-1-2027)
- Justice of the Supreme Court (Full term commencing 1-2-2027)
- Secretary of State of Ohio
- Treasurer of State of Ohio
- U.S. Senator from Ohio
- Ohio State Representative, District 77
- Ohio State Senator, District 31
- U.S. Representative, Ohio's 6th District
- U.S. Representative, Ohio's 7th District
| Jurisdiction | Type | Question | Millage or amount | Length |
|---|---|---|---|---|
| Chester Township | Tax Levy (Renewal) | Renews a 1.9-mill property tax levy for the roads, streets & bridges of Chester Township for 5 years, beginning in 2026. | 1.9 mills | 5 years |
| Doylestown Village | Miscellaneous | Miscellaneous, for Shall a commission be chosen to draw up a statement of conditions for the merger of the village of Doylestown & Chippewa Township?.Ballot language: Proposed Merger Commission Village of DoylestownA majority affirmative vote is necessary for passage. Shall a commission be chosen to draw up a statement of conditions for merger of the political subdivisions of the Village of Doylestown and Chippewa Township? | — | — |
| Chippewa Township | Miscellaneous | Miscellaneous, for Shall a commission be chosen to draw up a statement of conditions for the merger of the Village of Doylestown & Chippewa Township?.Ballot language: Proposed Merger Commission Chippewa TownshipA majority affirmative vote is necessary for passage. Shall a commission be chosen to draw up a statement of conditions for merger of the political subdivisions of the Village of Doylestown and Chippewa Township? | — | — |
| Dalton Local School District | Tax Levy (Renewal) | Renews a 2-mill property tax levy for the permanent improvements of Dalton Local School District for 5 years, beginning in 2026. | 2 mills | 5 years |
| Orrville City School District | Income Tax (Additional) | Authorizes an additional 1% income tax for the current expenses of Orrville City School District for 5 years, beginning in 2027. | — | 5 years |
| Doylestown Village | Miscellaneous | Miscellaneous, for Shall the Village Council consider adopting zoning regulations to permit adult-use marijuana dispensaries within the BD Downtown Business District and the BG General Business District?.Ballot language: Advisory Question Ballot #2 Village of Doylestown - Adult-Use Marijuana DispensariesA majority affirmative vote is necessary for passage. If passed, this advisory question would express the opinion of the electors regarding whether the Village Council should consider adopting zoning regulations to permit adult-use marijuana dispensaries within the BD Downtown Business District and the BG General Business District. Should the Village Council consider adopting zoning regulations to permit adult-use marijuana dispensaries within the BD Downtown Business District and BG General Business District? | — | — |
| Doylestown Village | Miscellaneous | Miscellaneous, for Shall the village Council consider adopting zoning regulations to permit and regulate short-term rental properties within the BD Downtown Business District and the BG General Business District?.Ballot language: Advisory Question Ballot #1 Village of Doylestown - Short-Term Rental PropertiesA majority affirmative vote is necessary for passage. If passed, this advisory question would express the opinion of the electors regarding whether the Village Council should consider adopting zoning regulations to permit and regulate short-term rental properties within the BD Downtown Business District and the BG General Business District. Should the Village Council consider adopting zoning regulations to permit and regulate short-term rental properties within the BD Downtown Business District and BG General Business District? | — | — |
| Triway Local School District | Income Tax (Additional) | Authorizes an additional 0.75% income tax for the current expenses of Triway Local School District for 3 years, beginning January 1, 2027. | — | 3 years |
| Northwestern Local School District | Tax Levy (Renewal) | Renews a 1.8-mill property tax levy for the current operating expenses of Northwestern Local School District for 5 years, beginning in 2026. | 1.8 mills | 5 years |
| Smithville Village | Miscellaneous | Miscellaneous, for Shall the proposed ordinance repealing Ordinance 2025-4 be adopted?.Ballot language: Proposed Ordinance (By Petition) Village of SmithvilleA majority affirmative vote is necessary for passage. An ordinance proposed by Initiative Petition of the Electors of the Village of Smithville, Wayne County, Ohio, repealing Ordinance 2025-4, entitled “An ordinance providing for photo traffic enforcement within the Village of Smithville,” enacted by the Village Council on March 18, 2025. Shall the proposed ordinance to repeal Ordinance 2025-4 be adopted? | — | — |
| Wayne County Joint Vocational School District | Tax Levy (Renewal) | Renews a 0.5-mill property tax levy for the general permanent improvements of Wayne County Joint Vocational School District for 5 years, beginning in 2027. | 0.5 mills | 5 years |
| Canaan Township | Tax Levy (Additional) | Authorizes an additional 2.5-mill property tax levy for the fire protection & EMS of Canaan Township for 3 years, beginning in 2026. | 2.5 mills | 3 years |
| Burbank Village | Tax Levy (Renewal) | Renews a 3-mill property tax levy for the current expenses of Burbank Village for 5 years, beginning in 2027. | 3 mills | 5 years |
| Burbank Village | Tax Levy (Renewal) | Renews a 3-mill property tax levy for the current expenses of Burbank Village for 5 years, beginning in 2027. | 3 mills | 5 years |
| Burbank Village | Tax Levy (Renewal) | Renews a 4-mill property tax levy for the current expenses of Burbank Village for 5 years, beginning in 2027. | 4 mills | 5 years |
| Clinton Township | Tax Levy (Renewal) | Renews a 1.5-mill property tax levy for the fire protection & EMS of Clinton Township for 4 years, beginning in 2027. | 1.5 mills | 4 years |
| Wooster Township | Tax Levy (Additional) | Authorizes an additional 1.5-mill property tax levy for the fire protection & EMS of Wooster Township for 5 years, beginning in 2026. | 1.5 mills | 5 years |
| Chippewa Local School District | Income Tax (Renewal) | Renews a 1% income tax for the current operating expenses of Chippewa Local School District, beginning January 1, 2028. | — | — |
| Rittman City | Miscellaneous | Miscellaneous, for Charter Amendment: Sections 9.05 & 3.09.Ballot language: Proposed Charter Amendment Repeal of Section 9.05, addition of Section 3.09 City of RittmanA majority affirmative vote is necessary for passage. Shall the Charter of the City of Rittman be amended to remove Section 9.05. If passed, this amendment would eliminate outdated language regarding the Civil Service Status of employees immediately after Rittman gained status as a city. Shall the Charter of the City of Rittman be amended by the addition of Section 3.09 The Council, Removal. If passed, this amendment would add a new section allowing for the removal of a member of City Council by other members of City Council for bad behavior, criminal conduct, or absenteeism. Shall Section 9.05 be repealed and Section 3.09 be added to the Charter of the City of Rittman? | — | — |
| Rittman City | Miscellaneous | Miscellaneous, for Charter Amendment: Articles III, IV, VII, XII & XIII.Ballot language: Proposed Charter Amendment Articles III, IV, VII, XII and XIII City of RittmanA majority affirmative vote is necessary for passage. Shall the Charter of the City of Rittman be amended by changing Articles III, IV, VII, XII and XIII. If passed, this amendment would: a. Change the date of the organizational meeting from the first Monday in December of each year to the first regular meeting of each year. b. Change the date that elected officials take office from the first Monday in December of each year to January 1st of each year. c. Change the deadline by which petitions for nomination for elective offices in the Municipality are to be filed with the Board of Elections from 75 to 90 days from the date of the election. Shall Articles III, IV, VII, XII and XIII of the Charter of the City of Rittman be amended? | — | — |
| Rittman City | Miscellaneous | Miscellaneous, for Charter Amendment: Section 3.06.Ballot language: Proposed Charter Amendment Section 3.06 City of RittmanA majority affirmative vote is necessary for passage. Shall the Charter of the City of Rittman be amended by changing Section 3.06 The Council, Meetings. If passed, this amendment would allow City Council to hold executive session for any reason allowable by the Ohio Revised code. Shall Section 3.06 of the Charter of the City of Rittman be amended? | — | — |
| Rittman City | Miscellaneous | Miscellaneous, for Charter Amendment: Section 4.03.Ballot language: Proposed Charter Amendment Section 4.03 City of RittmanA majority affirmative vote is necessary for passage. Shall the Charter of the City of Rittman be amended by changing Section 4.03 The Mayor, Legislative Powers. If passed, the amendment would clarify language that the Mayor, when invited into executive sessions of City Council, is only an attendee and does not preside. Shall Section 4.03 of the Charter of the City of Rittman be amended? | — | — |
| Rittman City | Miscellaneous | Miscellaneous, for Charter Amendment: Section 4.05.Ballot language: Proposed Charter Amendment Section 4.05 City of RittmanA majority affirmative vote is necessary for passage. Shall the Charter of the City of Rittman be amended by changing Section 4.05 The Mayor, Vacancies. If passed this amendment would clarify the procedure by which a member of City Council is nominated to and can become Mayor in the event the office of Mayor becomes vacant. Shall Section 4.05 of the Charter of the City of Rittman be amended? | — | — |
| Rittman City | Miscellaneous | Miscellaneous, for Charter Amendment: Section 5.01.Ballot language: Proposed Charter Amendment Section 5.01 City of RittmanA majority affirmative vote is necessary for passage. Shall the Charter of the City of Rittman be amended by changing Section 5.01 The Municipal Manager, Appointment, Removal and Qualifications. If passed, this amendment would require an annual review of the Municipal Manager by City Council. Shall Section 5.01 of the Charter of the City of Rittman be amended? | — | — |
| Rittman City | Miscellaneous | Miscellaneous, for Charter Amendment: Articles VI & IX.Ballot language: Proposed Charter Amendment Articles VI and IX City of RittmanA majority affirmative vote is necessary for passage. Shall the Charter of the City of Rittman be amended by changing Articles VI and IX. If passed, this amendment would change language to reflect that the Fire Department and EMS Department have merged into one department. Shall Articles VI and IX of the Charter of the City of Rittman be amended? | — | — |
| Rittman City | Miscellaneous | Miscellaneous, for Charter Amendment: Section 6.05.Ballot language: Proposed Charter Amendment Section 6.05 City of RittmanA majority affirmative vote is necessary for passage. Shall the Charter of the City of Rittman be amended by changing Section 6.05 Administrative Officers and Divisions, Law Director. If passed, this amendment would require that the Law Director be an attorney-at-law in good standing with the state bar association and that the Law Director oversee representation of the City in all cases as well as provide direct representation. Shall Section 6.05 of the Charter of the City of Rittman be amended? | — | — |
| Rittman City | Miscellaneous | Miscellaneous, for Charter Amendment: Section 9.01.Ballot language: Proposed Charter Amendment Section 9.01 City of RittmanA majority affirmative vote is necessary for passage. Shall the Charter of the City of Rittman be amended by changing Section 9.01 Civil Service Commission, Civil Service Commission and System. If passed, this amendment would update old language concerning the establishment of a Civil Service Commission in the event Rittman becomes a city as Rittman is already a city. Shall Section 9.01 of the Charter of the City of Rittman be amended? | — | — |
| Rittman City | Miscellaneous | Miscellaneous, for Charter Amendment: Section 9.02.Ballot language: Proposed Charter Amendment Section 9.02 City of RittmanA majority affirmative vote is necessary for passage. Shall the Charter of the City of Rittman be amended by changing Section 9.02 Civil Service Commission, Composition and Terms. If passed, this amendment would change the term an individual serves on the Civil Service Commission from six (6) years to three (3) years. Shall Section 9.02 of the Charter of the City of Rittman be amended? | — | — |
| Rittman City | Miscellaneous | Miscellaneous, for Charter Amendment: Section 11.01.Ballot language: Proposed Charter Amendment Section 11.01 City of RittmanA majority affirmative vote is necessary for passage. Shall the Charter of the City of Rittman be amended by changing 11.01 Cemetery Board, Composition and Terms. If passed, this amendment would add a member of City Council to serve on the Cemetery Board. Shall Section 11.01 of the Charter of the City of Rittman be amended? | — | — |
| Rittman City | Miscellaneous | Miscellaneous, for Charter Amendment: Section 12.02.Ballot language: Proposed Charter Amendment Section 12.02 City of RittmanA majority affirmative vote is necessary for passage. Shall the Charter of the City of Rittman be amended by changing Section 12.02 Finance, Preparation and Submission of Budget. If passed, this amendment would change the deadline for submission of the budget to City Council from January 1st to December 31st of each year and clarify language. Shall Section 12.02 of the Charter of the City of Rittman be amended? | — | — |
| Rittman City | Miscellaneous | Miscellaneous, for Charter Amendment: Section 12.06.Ballot language: Proposed Charter Amendment Section 12.06 City of RittmanA majority affirmative vote is necessary for passage. Shall the Charter of the City of Rittman be amended by changing Section 12.06 Finance, Finance Director. If passed, this amendment would require an annual review of the Finance Director by the City Council. Shall Section 12.06 of the Charter of the City of Rittman be amended? | — | — |
| Rittman City | Miscellaneous | Miscellaneous, for Charter Amendment: Section 13.04.Ballot language: Proposed Charter Amendment Section 13.04 City of RittmanA majority affirmative vote is necessary for passage. Shall the Charter of the City of Rittman be amended by changing Section 13.04 Nominations, Elections and Qualifications, Qualifications. If passed, this amendment would reduce the residency requirement to be eligible to be an elected officer of the Municipality from two (2) years to one (1) year. Shall Section 13.04 of the Charter of the City of Rittman be amended? | — | — |
| Rittman City | Miscellaneous | Miscellaneous, for Charter Amendment: Section 16.01.Ballot language: Proposed Charter Amendment Section 16.01 City of RittmanA majority affirmative vote is necessary for passage. Shall the Charter of the City of Rittman be amended by changing Section 16.01 Charter Review Commission, Charter Review Commission. If passed, this amendment would amend the schedule in which the Charter Review Commission convenes to intentionally misalign it with the election of new members of City Council. Shall Section 16.01 of the Charter of the City of Rittman be amended? | — | — |
| Baughman Township 2 - GiGi's Diner LLC Precinct | Liquor Option | Local liquor option on Sunday sales, in Baughman Township 2 - GiGi's Diner LLC Precinct. | — | — |
| Plain Township 1 - Lincoln Way Vineyards Inc. Precinct | Liquor Option | Local liquor option on Sunday sales, in Plain Township 1 - Lincoln Way Vineyards Inc. Precinct. | — | — |
| Salt Creek 1 - Fredericksburg American Legion Post 651 Precinct | Liquor Option | Local liquor option on Sunday sales, in Salt Creek 1 - Fredericksburg American Legion Post 651 Precinct. | — | — |
| Salt Creek 1 - Fredericksburg American Legion Post 651 Precinct | Liquor Option | Local liquor option on particular location, in Salt Creek 1 - Fredericksburg American Legion Post 651 Precinct. | — | — |
What's on my ballot · Election 2026
Sources for the presidential results and turnout above
Data from Wikipedia, CC BY-SA 4.0:
- 1852: 1852 United States presidential election in Ohio
- 1856: 1856 United States presidential election in Ohio
- 1860: 1860 United States presidential election in Ohio
- 1864: 1864 United States presidential election in Ohio
- 1868: 1868 United States presidential election in Ohio
- 1872: 1872 United States presidential election in Ohio
- 1876: 1876 United States presidential election in Ohio
- 1880: 1880 United States presidential election in Ohio
- 1884: 1884 United States presidential election in Ohio
- 1888: 1888 United States presidential election in Ohio
- 1892: 1892 United States presidential election in Ohio
- 1896: 1896 United States presidential election in Ohio
- 1900: 1900 United States presidential election in Ohio
- 1904: 1904 United States presidential election in Ohio
- 1908: 1908 United States presidential election in Ohio
- 1912: 1912 United States presidential election in Ohio
- 1916: 1916 United States presidential election in Ohio
- 1920: 1920 United States presidential election in Ohio
- 1924: 1924 United States presidential election in Ohio
- 1928: 1928 United States presidential election in Ohio
- 1932: 1932 United States presidential election in Ohio
- 1936: 1936 United States presidential election in Ohio
- 1940: 1940 United States presidential election in Ohio
- 1944: 1944 United States presidential election in Ohio
- 1948: 1948 United States presidential election in Ohio
- 1952: 1952 United States presidential election in Ohio
- 1956: 1956 United States presidential election in Ohio
- 1960: 1960 United States presidential election in Ohio
- 1964: 1964 United States presidential election in Ohio
- 1968: 1968 United States presidential election in Ohio
- 1972: 1972 United States presidential election in Ohio
- 1976: 1976 United States presidential election in Ohio
- 1980: 1980 United States presidential election in Ohio
- Ohio Secretary of State: oh_1984_general_president_county.xlsx -- Ohio Secretary of State Past Election Results portal
- MIT Election Data and Science Lab (MEDSL), Harvard Dataverse: County Presidential Election Returns 2000-2024 (V20)
All 44 presidential elections 1852-2024 present. Turnout 1996-2024 per the ruling's storage section (county-level turnout before 1996 is confirmed absent from the OH SOS portal per A/sources/CITATIONS.md; not this task's scope to invent from elsewhere).
Where Wayne County sits
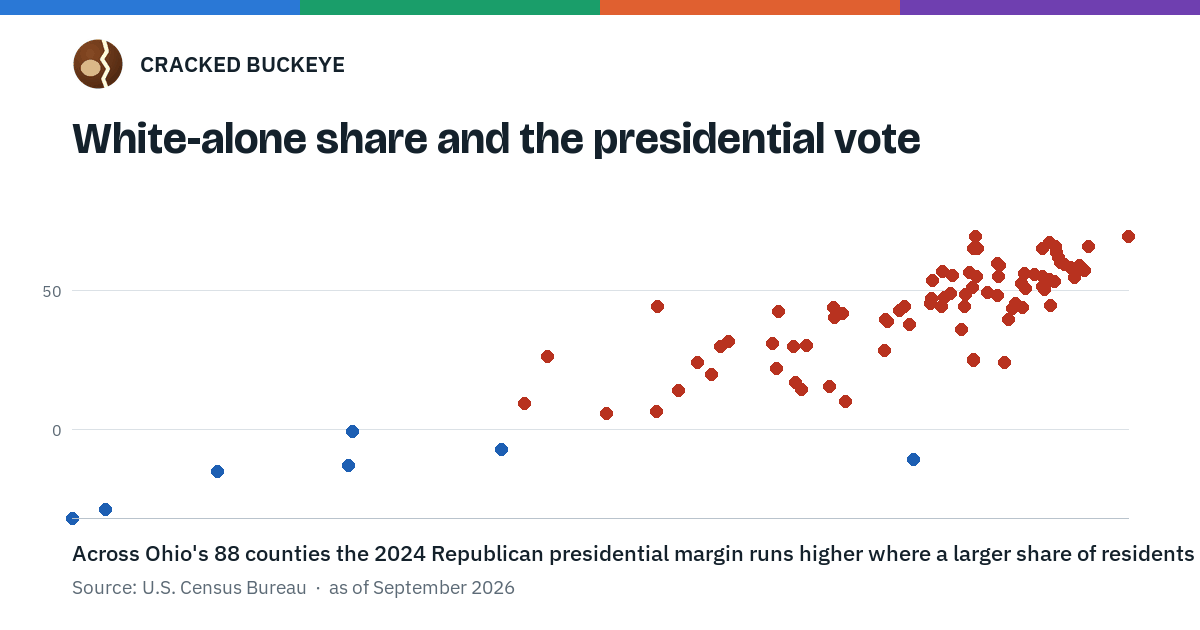
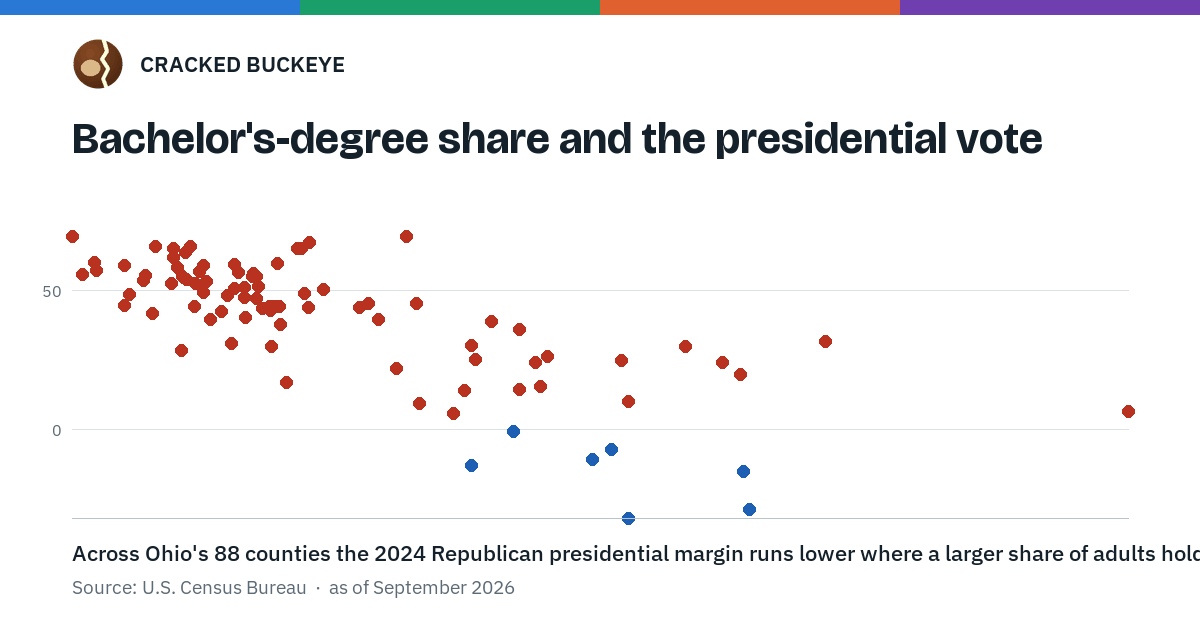
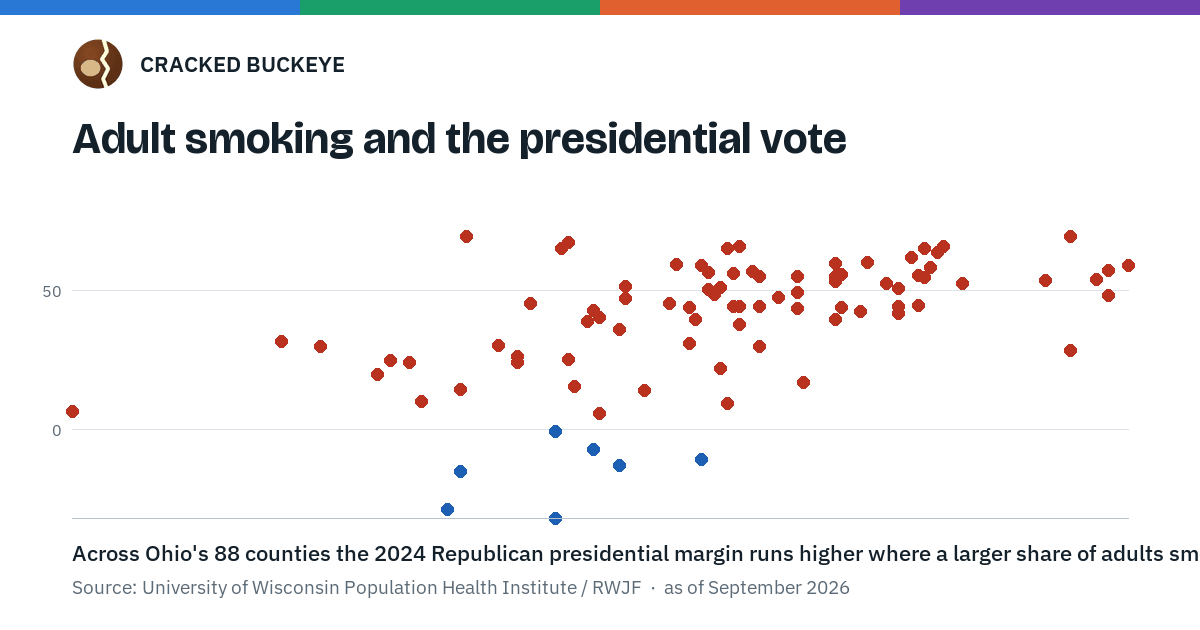
Three measures this atlas holds, set against how all 88 counties voted for president. Wayne County is the marked dot on each.
This is a pattern across counties, not a fact about any voter.
Wayne County sits higher than 60 of the 88 counties measured on share white alone. White-alone share and the presidential vote
Wayne County sits higher than 59 of the 88 counties measured on share 25+ with a bachelor's degree or higher. Bachelor's-degree share and the presidential vote
The numbers behind this figure, as a table
| County | Adult smoking (County Health Rankings, 2024) | Presidential margin, 2024 (R minus D, points) |
|---|---|---|
| Adams | 24.8% | R+66.1 |
| Allen | 21.9% | R+44.5 |
| Ashland | 21.1% | R+50.4 |
| Ashtabula | 26.8% | R+28.6 |
| Athens | 21.0% | D+10.8 |
| Auglaize | 18.8% | R+65.1 |
| Belmont | 22.2% | R+47.6 |
| Brown | 24.3% | R+61.8 |
| Butler | 18.1% | R+26.5 |
| Carroll | 22.5% | R+55.2 |
| Champaign | 21.3% | R+51.2 |
| Clark | 21.9% | R+29.8 |
| Clermont | 19.7% | R+36.1 |
| Clinton | 21.9% | R+55.1 |
| Columbiana | 22.5% | R+49.4 |
| Coshocton | 25.1% | R+52.6 |
| Crawford | 23.1% | R+53.4 |
| Cuyahoga | 18.7% | D+31.7 |
| Darke | 21.6% | R+65.8 |
| Defiance | 19.4% | R+40.2 |
| Delaware | 11.1% | R+6.7 |
| Erie | 20.1% | R+14.3 |
| Fairfield | 18.1% | R+24.3 |
| Fayette | 24.4% | R+55.6 |
| Franklin | 17.0% | D+28.7 |
| Fulton | 19.3% | R+42.8 |
| Gallia | 23.1% | R+59.8 |
| Geauga | 16.4% | R+24.3 |
| Greene | 15.9% | R+20.0 |
| Guernsey | 23.9% | R+52.4 |
| Hamilton | 17.2% | D+15.0 |
| Hancock | 19.2% | R+38.9 |
| Hardin | 23.1% | R+55.2 |
| Harrison | 23.2% | R+55.7 |
| Henry | 19.8% | R+47.1 |
| Highland | 24.7% | R+63.7 |
| Hocking | 24.4% | R+44.6 |
| Holmes | 26.8% | R+69.7 |
| Huron | 21.6% | R+44.4 |
| Jackson | 24.6% | R+58.4 |
| Jefferson | 24.1% | R+44.4 |
| Knox | 20.5% | R+45.3 |
| Lake | 17.2% | R+14.5 |
| Lawrence | 24.1% | R+50.9 |
| Licking | 17.8% | R+30.3 |
| Logan | 21.1% | R+56.7 |
| Lorain | 19.4% | R+5.8 |
| Lucas | 19.7% | D+12.7 |
| Madison | 20.8% | R+44.1 |
| Mahoning | 21.4% | R+9.5 |
| Marion | 24.1% | R+41.7 |
| Medina | 16.1% | R+25.0 |
| Meigs | 27.4% | R+57.4 |
| Mercer | 18.9% | R+67.2 |
| Miami | 18.3% | R+45.5 |
| Monroe | 23.6% | R+60.3 |
| Montgomery | 18.7% | D+0.5 |
| Morgan | 26.4% | R+53.6 |
| Morrow | 21.5% | R+56.2 |
| Muskingum | 21.5% | R+44.3 |
| Noble | 24.5% | R+65.1 |
| Ottawa | 18.9% | R+25.3 |
| Paulding | 21.8% | R+56.8 |
| Perry | 24.5% | R+54.9 |
| Pickaway | 21.2% | R+49.0 |
| Pike | 27.2% | R+54.0 |
| Portage | 19.0% | R+15.7 |
| Preble | 20.6% | R+59.6 |
| Putnam | 17.3% | R+69.4 |
| Richland | 23.5% | R+42.7 |
| Ross | 23.1% | R+39.7 |
| Sandusky | 20.8% | R+31.1 |
| Scioto | 27.4% | R+48.2 |
| Seneca | 21.6% | R+37.9 |
| Shelby | 21.4% | R+65.3 |
| Stark | 21.3% | R+22.1 |
| Summit | 19.3% | D+7.0 |
| Trumbull | 22.6% | R+16.9 |
| Tuscarawas | 22.5% | R+43.6 |
| Union | 15.0% | R+29.9 |
| Van Wert | 21.0% | R+59.0 |
| Vinton | 27.7% | R+59.0 |
| Warren | 14.4% | R+31.8 |
| Washington | 23.2% | R+44.1 |
| Wayne | 20.9% | R+39.6 |
| Williams | 21.2% | R+48.7 |
| Wood | 16.6% | R+10.3 |
| Wyandot | 19.8% | R+51.6 |
Wayne County sits higher than 35 of the 88 counties measured on adult smoking (County Health Rankings). Adult smoking and the presidential vote
Rain and snow
How much has actually fallen on Wayne County, day by day, from 1893 to now. Daily totals, not averages.
- rain, last 30 days
- 1.42 in
- 2026-09-29 to 2026-10-28
- rain so far in 2026
- 35.3 in
- about normal for the date
- snow so far in 2026
- 25.9 in
- a normal year brings 30.5 in
- a normal year
- 39.8 in
- average of 30 years, 1991-2020
| Month | Rain (in) | Snow (in) | Days counted |
|---|---|---|---|
| October 2026 | 1.42 | — | 28 |
| September 2026 | 3.77 | — | 30 |
| August 2026 | 4.30 | — | 31 |
| July 2026 | 4.25 | — | 31 |
| June 2026 | 3.03 | — | 30 |
| May 2026 | 4.93 | — | 31 |
| April 2026 | 6.63 | 0.1 | 30 |
| March 2026 | 4.67 | 1.5 | 31 |
| February 2026 | 0.87 | 5.0 | 28 |
| January 2026 | 1.44 | 19.3 | 31 |
| December 2025 | 1.88 | 9.5 | 31 |
| November 2025 | 1.46 | 2.1 | 30 |
| Wettest year | 1990 — 51.7 in |
|---|---|
| Driest year | 1963 — 24.9 in |
| Snowiest year | 1910 — 69.5 in |
| Wettest day on record | 5 July 1969 — 8.40 in |
| Heaviest snowfall in a day | 2 December 1974 — 14.02 in |
| Deepest snow on the ground | 10 November 1913 — 17.99 in |
Almost every day here is a measurement: 99% of them come from a rain gauge standing inside Wayne County itself.
48,684 days of records, 1893-01-01 to 2026-10-28. Source: NOAA NCEI GHCN-Daily, 3,240 gauges in and around Ohio. A day is "gauged" when a gauge standing inside the boundary reported it, and the value is the mean of those gauges. Otherwise it is interpolated by inverse distance from every gauge reporting within 50 miles. Nothing is carried forward, back-filled or smoothed. Against NOAA nClimDiv county monthly precipitation over 136,848 complete county-months (checked 2026-10-31): correlation 0.9515, median absolute difference 0.217 in a month. Built 2026-10-31 from the Cracked Buckeye precipitation archive. Snow is the softer number — snowfall is measured by hand with a ruler, no agency publishes a gridded county snowfall series, and blowing snow defeats every observer.
Environmental permits and filings
What Ohio EPA has on file for Wayne County: permits, inspections, violations, cleanups and the state loans behind sewer and water work. Every line links to the agency's own document.
- facilities and sites on file
- 2,512
- everything Ohio EPA files under this county
- private households
- 456
- counted, not named: permits filed under a person's name
Data centers, power and big tech here. Ohio EPA files that name a data-center company, a power plant or substation, or a large technology firm:
- ORRVILLE MUNICIPAL POWER PLANT (air pollution, wastewater and stormwater discharge, latest May 15, 2026)
| Program | Facilities and sites |
|---|---|
| Wastewater and stormwater discharge | 712 |
| Sewer and water-line construction | 701 |
| Public drinking water | 308 |
| Air pollution | 176 |
| Hazardous waste | 135 |
| Spills and emergencies | 78 |
| Source-water protection | 65 |
| Wetland and stream fill | 53 |
| Beneficial Use | 48 |
| Voluntary cleanup | 40 |
| Contaminated-site cleanup | 37 |
| Site assessment | 36 |
| 18 smaller programs |
| Date | Facility or site | What |
|---|---|---|
| THE WILL-BURT CO | Air pollution permit | |
| SMITHVILLE WWTP | Wastewater and stormwater discharge permit | |
| CLEAR CREEK | Wastewater and stormwater discharge permit | |
| LITTLE CHIPPEWA ESTATES PWS | Public drinking water compliance letter | |
| SUNDIAL MOBILE HOME PARK PWS | Public drinking water inspection | |
| TRICOR METALS PWS | Public drinking water notice of violation | |
| T ROAD FINISHING LLC | Air pollution permit | |
| RITTMAN PAPERBOARD WEST OF THE RIVER STYX | Voluntary cleanup technical help | |
| WOODS AT SILVER CREEK | Wastewater and stormwater discharge permit | |
| CLEAR CREEK | Wastewater and stormwater discharge permit | |
| RED ROSE PROPERTIES LLC - DAVE BURKHOLDER | Wastewater and stormwater discharge permit | |
| DOYLESTOWN VILLAGE PWS | Public drinking water notice of violation | |
| WOOSTER CITY WRRF | Air pollution report | |
| NATIONAL LIME AND STONE CO | Air pollution report | |
| THE COLLEGE OF WOOSTER | Air pollution report | |
| RED ROSE PROPERTIES LLC - DAVE BURKHOLDER | Wastewater and stormwater discharge permit | |
| PACKAGING CORP OF AMERICA, RITTMAN | Voluntary cleanup inspection | |
| PINE TREE BARN, INC. PWS | Public drinking water compliance letter | |
| DOYLESTOWN VILLAGE PWS | Public drinking water compliance letter | |
| ZOLLINGER C&D LANDFILL | Construction-debris landfills report | |
| MOUNT EATON LANDFILL | Landfills inspection | |
| GALEHOUSE CONSTRUCTION PWS | Public drinking water compliance letter | |
| LINCOLN TERRACE ESTATES PWS | Public drinking water violation resolved | |
| MOUNT EATON LANDFILL | Landfills inspection | |
| MOUNT EATON LANDFILL | Landfills report |
Source: Ohio EPA eDocument portal (edocpub.epa.ohio.gov), indexed 2026-10-14. Facilities are placed on the map from Ohio EPA's own map layers, EPA's Facility Registry, coordinates written in the filings, or a geocoded street address. A permit filed under a private person's name (most are household septic systems) is counted but never named, placed or linked; licenses for individual workers and open-burning notices are left out entirely.
Quick answers
What is the county seat of Wayne County, Ohio?
Wooster is the county seat of Wayne County, Ohio. Wooster, laid out in the fall of 1808 by John Bever, William Henry and Joseph H. Source
When was Wayne County, Ohio established?
Wayne County was established on March 1, 1812. Source
What is the population of Wayne County, Ohio?
Wayne County had 116,758 residents (July 2025 estimate).
How did Wayne County, Ohio vote in the 2024 presidential election?
In the November 5, 2024 presidential election, Wayne County voters cast 53,150 votes for president: Kamala D Harris (D) 29.9%, Chase Oliver (L) 0.4%, Donald J Trump (R) 69.2%. Donald J Trump carried the county. Source
How did Wayne County get its name?
Named for Major General Anthony 'Mad Anthony' Wayne, whose 1794 victory at Fallen Timbers and the 1795 Treaty of Greenville he negotiated opened this part of Ohio to settlement. Source
How many cities, villages and townships are in Wayne County, Ohio?
Wayne County has 33 cities, villages and townships, and 15 ZIP codes reach into it.
Notable people from Wayne County
Ohioans tied to this place, each with a sourced profile. All notable Ohioans
History from Wayne County
People and inventions tied to this place, each with its sources. All people · All inventions
Cite and data
Cite this page as:
Cracked Buckeye, "Wayne County", https://crackedbuckeye.com/county/wayne/, built 2026-10-31, accessed [date].
How to cite · Report a correction · Built 2026-10-31