An insight across Ohio's 88 counties

White-alone share and the presidential vote

Across Ohio's 88 counties the 2024 Republican presidential margin runs higher where a larger share of residents is white alone (Spearman rho 0.82; partial rho 0.56 with log population held fixed; 0.81 without Cuyahoga and Franklin; n = 88).

Correct this page · hello@crackedbuckeye.com

Where the counties sit

One dot per county: Share white alone in 2024 across the bottom, the 2024 presidential margin in points up the side. Every dot links to that county's own result for that election.
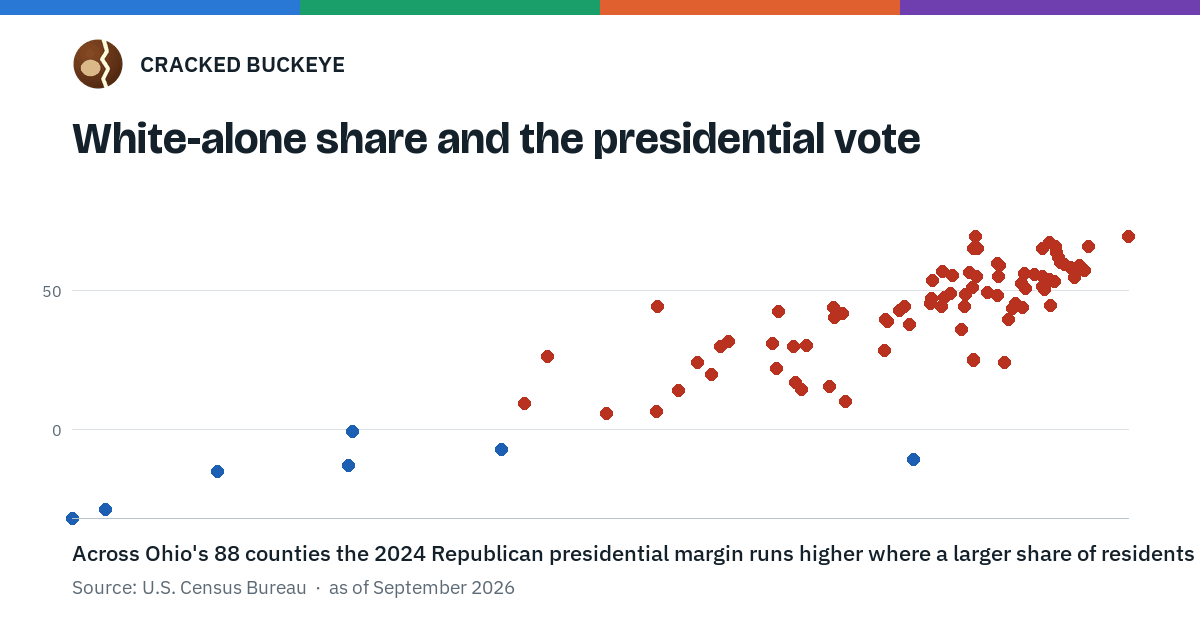
White-alone share and the presidential voteAcross Ohio's 88 counties the 2024 Republican presidential margin runs higher where a larger share of residents is white alone (Spearman rho 0.82; partial rho 0.56 with log population held fixed; 0.81 without Cuyahoga and Franklin; n = 88).D+20.0tiedR+20.0R+40.0R+60.060.0%70.0%80.0%90.0%Adams County: 96.4%, 2024 presidential margin R+66.1 pointsAllen County: 80.0%, 2024 presidential margin R+44.5 pointsAshland County: 94.7%, 2024 presidential margin R+50.4 pointsAshtabula County: 88.6%, 2024 presidential margin R+28.6 pointsAthens County: 89.7%, 2024 presidential margin D+10.8 pointsAuglaize County: 94.6%, 2024 presidential margin R+65.1 pointsBelmont County: 90.9%, 2024 presidential margin R+47.6 pointsBrown County: 95.2%, 2024 presidential margin R+61.8 pointsButler County: 75.8%, 2024 presidential margin R+26.5 pointsCarroll County: 94.6%, 2024 presidential margin R+55.2 pointsChampaign County: 92.0%, 2024 presidential margin R+51.2 pointsClark County: 82.4%, 2024 presidential margin R+29.8 pointsClermont County: 91.6%, 2024 presidential margin R+36.1 pointsClinton County: 92.1%, 2024 presidential margin R+55.1 pointsColumbiana County: 92.6%, 2024 presidential margin R+49.4 pointsCoshocton County: 94.7%, 2024 presidential margin R+52.6 pointsCrawford County: 95.1%, 2024 presidential margin R+53.4 pointsCuyahoga County: 57.7%, 2024 presidential margin D+31.7 pointsCuyahogaDarke County: 95.1%, 2024 presidential margin R+65.8 pointsDefiance County: 86.7%, 2024 presidential margin R+40.2 pointsDelaware County: 79.9%, 2024 presidential margin R+6.7 pointsErie County: 80.8%, 2024 presidential margin R+14.3 pointsFairfield County: 81.5%, 2024 presidential margin R+24.3 pointsFayette County: 91.2%, 2024 presidential margin R+55.6 pointsFranklin County: 59.0%, 2024 presidential margin D+28.7 pointsFranklinFulton County: 89.2%, 2024 presidential margin R+42.7 pointsGallia County: 92.9%, 2024 presidential margin R+59.8 pointsGeauga County: 93.2%, 2024 presidential margin R+24.3 pointsGreene County: 82.0%, 2024 presidential margin R+20.0 pointsGuernsey County: 93.8%, 2024 presidential margin R+52.4 pointsHamilton County: 63.2%, 2024 presidential margin D+15.0 pointsHancock County: 88.7%, 2024 presidential margin R+38.9 pointsHardin County: 93.0%, 2024 presidential margin R+55.2 pointsHarrison County: 94.3%, 2024 presidential margin R+55.7 pointsHenry County: 90.4%, 2024 presidential margin R+47.2 pointsHighland County: 95.2%, 2024 presidential margin R+63.7 pointsHocking County: 94.9%, 2024 presidential margin R+44.6 pointsHolmes County: 97.9%, 2024 presidential margin R+69.7 pointsHuron County: 91.7%, 2024 presidential margin R+44.4 pointsJackson County: 95.7%, 2024 presidential margin R+58.4 pointsJefferson County: 89.4%, 2024 presidential margin R+44.4 pointsKnox County: 93.6%, 2024 presidential margin R+45.3 pointsLake County: 85.5%, 2024 presidential margin R+14.5 pointsLawrence County: 94.0%, 2024 presidential margin R+50.9 pointsLicking County: 85.7%, 2024 presidential margin R+30.3 pointsLogan County: 91.9%, 2024 presidential margin R+56.7 pointsLorain County: 78.0%, 2024 presidential margin R+5.8 pointsLucas County: 68.2%, 2024 presidential margin D+12.7 pointsMadison County: 86.7%, 2024 presidential margin R+44.1 pointsMahoning County: 74.9%, 2024 presidential margin R+9.5 pointsMarion County: 87.0%, 2024 presidential margin R+41.7 pointsMedina County: 92.0%, 2024 presidential margin R+25.0 pointsMeigs County: 96.2%, 2024 presidential margin R+57.4 pointsMercer County: 94.9%, 2024 presidential margin R+67.2 pointsMiami County: 90.4%, 2024 presidential margin R+45.5 pointsMonroe County: 95.3%, 2024 presidential margin R+60.3 pointsMontgomery County: 68.4%, 2024 presidential margin D+0.5 pointsMorgan County: 90.5%, 2024 presidential margin R+53.6 pointsMorrow County: 94.0%, 2024 presidential margin R+56.2 pointsMuskingum County: 90.8%, 2024 presidential margin R+44.3 pointsNoble County: 92.2%, 2024 presidential margin R+65.1 pointsOttawa County: 92.0%, 2024 presidential margin R+25.3 pointsPaulding County: 90.8%, 2024 presidential margin R+56.8 pointsPerry County: 95.8%, 2024 presidential margin R+54.9 pointsPickaway County: 91.1%, 2024 presidential margin R+49.0 pointsPike County: 94.9%, 2024 presidential margin R+54.0 pointsPortage County: 86.5%, 2024 presidential margin R+15.7 pointsPreble County: 95.5%, 2024 presidential margin R+59.6 pointsPutnam County: 92.1%, 2024 presidential margin R+69.4 pointsRichland County: 84.6%, 2024 presidential margin R+42.7 pointsRoss County: 88.7%, 2024 presidential margin R+39.7 pointsSandusky County: 84.4%, 2024 presidential margin R+31.1 pointsScioto County: 92.9%, 2024 presidential margin R+48.2 pointsSeneca County: 89.6%, 2024 presidential margin R+37.9 pointsShelby County: 92.0%, 2024 presidential margin R+65.3 pointsStark County: 84.5%, 2024 presidential margin R+22.1 pointsSummit County: 74.0%, 2024 presidential margin D+7.0 pointsTrumbull County: 85.2%, 2024 presidential margin R+16.9 pointsTuscarawas County: 93.5%, 2024 presidential margin R+43.6 pointsUnion County: 85.2%, 2024 presidential margin R+29.9 pointsVan Wert County: 93.0%, 2024 presidential margin R+58.9 pointsVinton County: 96.0%, 2024 presidential margin R+59.0 pointsWarren County: 82.7%, 2024 presidential margin R+31.8 pointsWashington County: 93.9%, 2024 presidential margin R+44.1 pointsWayne County: 93.3%, 2024 presidential margin R+39.6 pointsWilliams County: 91.7%, 2024 presidential margin R+48.7 pointsWood County: 87.1%, 2024 presidential margin R+10.3 pointsWyandot County: 94.6%, 2024 presidential margin R+51.6 pointsShare white alone, 2024Presidential margin, 2024 (R minus D, points)
White-alone share and the presidential voteAcross Ohio's 88 counties the 2024 Republican presidential margin runs higher where a larger share of residents is white alone (Spearman rho 0.82; partial rho 0.56 with log population held fixed; 0.81 without Cuyahoga and Franklin; n = 88).Source: U.S. Census Bureau · as of 2026-09 · Download this chart
The numbers behind this figure, as a table
White-alone share and the presidential vote
CountyShare white alone, 2024Presidential margin, 2024 (R minus D, points)
adams96.4%R+66.1
allen80.0%R+44.5
ashland94.7%R+50.4
ashtabula88.6%R+28.6
athens89.7%D+10.8
auglaize94.6%R+65.1
belmont90.9%R+47.6
brown95.2%R+61.8
butler75.8%R+26.5
carroll94.6%R+55.2
champaign92.0%R+51.2
clark82.4%R+29.8
clermont91.6%R+36.1
clinton92.1%R+55.1
columbiana92.6%R+49.4
coshocton94.7%R+52.6
crawford95.1%R+53.4
Cuyahoga57.7%D+31.7
darke95.1%R+65.8
defiance86.7%R+40.2
delaware79.9%R+6.7
erie80.8%R+14.3
fairfield81.5%R+24.3
fayette91.2%R+55.6
Franklin59.0%D+28.7
fulton89.2%R+42.8
gallia92.9%R+59.8
geauga93.2%R+24.3
greene82.0%R+20.0
guernsey93.8%R+52.4
hamilton63.2%D+15.0
hancock88.7%R+38.9
hardin93.0%R+55.2
harrison94.3%R+55.7
henry90.4%R+47.1
highland95.2%R+63.7
hocking94.9%R+44.6
holmes97.9%R+69.7
huron91.7%R+44.4
jackson95.7%R+58.4
jefferson89.4%R+44.4
knox93.6%R+45.3
lake85.5%R+14.5
lawrence94.0%R+50.9
licking85.7%R+30.3
logan91.9%R+56.7
lorain78.0%R+5.8
lucas68.2%D+12.7
madison86.7%R+44.1
mahoning74.9%R+9.5
marion87.0%R+41.7
medina92.0%R+25.0
meigs96.2%R+57.4
mercer94.9%R+67.2
miami90.4%R+45.5
monroe95.3%R+60.3
montgomery68.4%D+0.5
morgan90.5%R+53.6
morrow94.0%R+56.2
muskingum90.8%R+44.3
noble92.2%R+65.1
ottawa92.0%R+25.3
paulding90.8%R+56.8
perry95.8%R+54.9
pickaway91.1%R+49.0
pike94.9%R+54.0
portage86.5%R+15.7
preble95.5%R+59.6
putnam92.1%R+69.4
richland84.6%R+42.7
ross88.7%R+39.7
sandusky84.4%R+31.1
scioto92.9%R+48.2
seneca89.6%R+37.9
shelby92.0%R+65.3
stark84.5%R+22.1
summit74.0%D+7.0
trumbull85.2%R+16.9
tuscarawas93.5%R+43.6
union85.2%R+29.9
van-wert93.0%R+59.0
vinton96.0%R+59.0
warren82.7%R+31.8
washington93.9%R+44.1
wayne93.3%R+39.6
williams91.7%R+48.7
wood87.1%R+10.3
wyandot94.6%R+51.6
As measured, from the county panel in this repository
FigureValueWhat it is
Counties measured88the measure in 2024 against the presidential vote in 2024
Spearman rho0.82the rank correlation across all counties measured
Partial Spearman rho0.56the same rank correlation with log population held fixed
Pearson r0.86the linear correlation, for comparison with the rank figure above
Spearman rho without Cuyahoga and Franklin0.81n = 86

Across all 88 counties the rank correlation is 0.82. With Cuyahoga and Franklin set aside, 86 counties, it is 0.81.

Election by election

The same pair of measures at each presidential election the measure reaches. The panels are drawn for 4 of the 5 elections measured, by a fixed rule that keeps one figure inside its size budget; the table below carries every one.
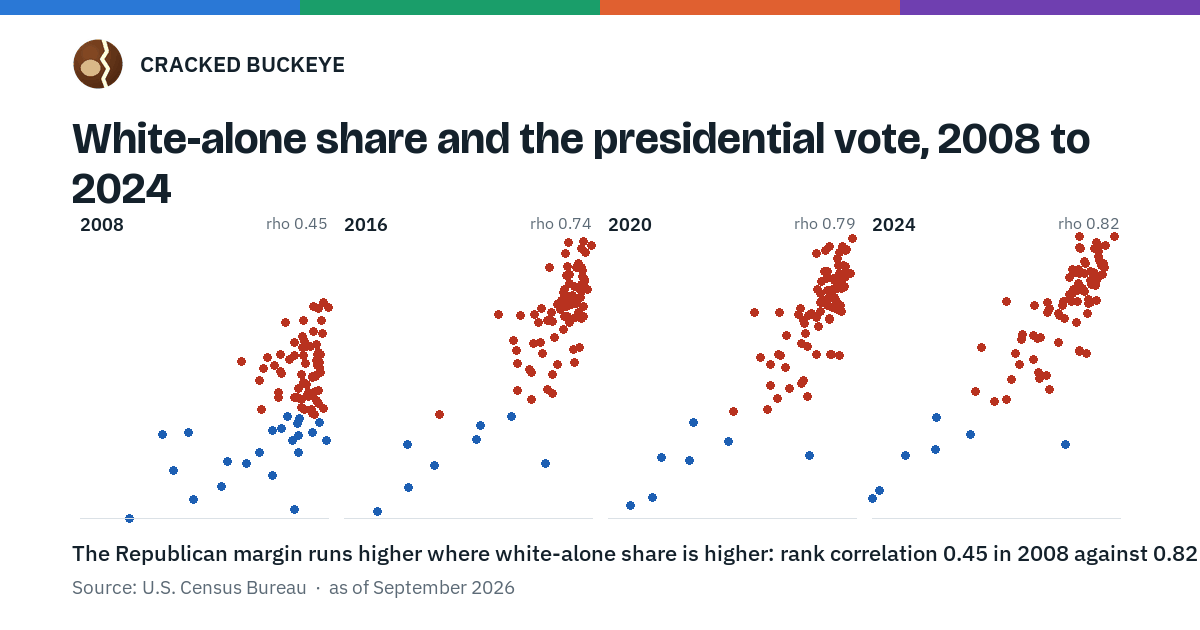
White-alone share and the presidential vote, 2008 to 2024The Republican margin runs higher where white-alone share is higher: rank correlation 0.45 in 2008 against 0.82 in 2024; 4 of the 5 elections measured are drawn.2008rho 0.45Adams 97.3% R+25Allen 84.5% R+21Ashland 97.0% R+24Ashtabula 93.9% D+14Athens 93.2% D+36Auglaize 97.2% R+42Belmont 93.7% D+3Brown 97.5% R+24Butler 88.7% R+23Carroll 97.3% R+5Champaign 95.0% R+20Clark 87.8% R+3Clermont 96.3% R+33Clinton 94.5% R+31Columbiana 95.6% R+8Coshocton 96.8% R+6Crawford 97.1% R+20Cuyahoga 65.9% D+39Darke 97.7% R+37Defiance 93.9% R+11Delaware 90.0% R+20Erie 87.5% D+14Fairfield 90.9% R+17Fayette 94.7% R+23Franklin 73.3% D+21Fulton 95.4% R+8Gallia 94.5% R+27Geauga 96.7% R+16Greene 88.2% R+19Guernsey 95.6% R+9Hamilton 71.3% D+7Hancock 93.2% R+24Hardin 96.9% R+21Harrison 96.0% R+3Henry 94.8% R+13Highland 95.9% R+27Hocking 96.6% R+1Holmes 98.8% R+42Huron 94.4% R+3Jackson 97.4% R+21Jefferson 92.1% D+0Knox 97.0% R+20Lake 94.0% D+1Lawrence 96.3% R+16Licking 94.5% R+16Logan 95.3% R+27Lorain 85.3% D+18Lucas 76.4% D+32Madison 90.9% R+24Mahoning 81.1% D+27Marion 90.6% R+9Medina 96.1% R+8Meigs 97.3% R+19Mercer 98.0% R+44Miami 94.9% R+29Monroe 98.5% D+9Montgomery 75.6% D+6Morgan 93.3% R+7Morrow 97.1% R+24Muskingum 93.7% R+7Noble 91.1% R+16Ottawa 96.2% D+6Paulding 95.2% R+12Perry 98.1% R+3Pickaway 92.5% R+22Pike 96.2% R+1Portage 92.9% D+9Preble 97.8% R+32Putnam 96.3% R+42Richland 87.4% R+14Ross 90.6% R+7Sandusky 91.1% D+5Scioto 94.5% R+6Seneca 94.9% R+3Shelby 94.6% R+37Stark 89.6% D+6Summit 82.1% D+17Trumbull 89.6% D+23Tuscarawas 97.3% D+2Union 93.2% R+28Van Wert 96.9% R+28Vinton 97.3% R+10Warren 91.8% R+36Washington 96.8% R+16Wayne 96.2% R+15Williams 96.8% R+9Wood 93.9% D+7Wyandot 97.6% R+172016rho 0.74Adams 97.1% R+58Allen 83.4% R+39Ashland 97.0% R+51Ashtabula 93.0% R+20Athens 91.0% D+18Auglaize 97.0% R+65Belmont 93.5% R+41Brown 97.1% R+54Butler 85.8% R+29Carroll 97.2% R+49Champaign 94.4% R+47Clark 86.4% R+20Clermont 95.4% R+43Clinton 94.5% R+55Columbiana 95.0% R+44Coshocton 96.9% R+46Crawford 96.9% R+49Cuyahoga 63.2% D+37Darke 97.7% R+63Defiance 91.7% R+37Delaware 88.8% R+17Erie 86.4% R+10Fairfield 89.0% R+28Fayette 94.2% R+49Franklin 68.3% D+28Fulton 94.2% R+39Gallia 94.8% R+58Geauga 96.7% R+26Greene 86.3% R+25Guernsey 95.8% R+45Hamilton 68.2% D+11Hancock 93.0% R+43Hardin 96.4% R+50Harrison 95.9% R+50Henry 94.6% R+42Highland 96.1% R+58Hocking 97.4% R+38Holmes 98.6% R+66Huron 94.8% R+39Jackson 97.1% R+51Jefferson 91.4% R+37Knox 96.5% R+40Lake 92.2% R+16Lawrence 95.4% R+46Licking 92.6% R+30Logan 95.0% R+55Lorain 85.4% D+0Lucas 72.8% D+19Madison 90.4% R+42Mahoning 80.2% D+3Marion 90.0% R+36Medina 95.6% R+26Meigs 97.5% R+53Mercer 97.4% R+68Miami 94.1% R+48Monroe 98.0% R+49Montgomery 73.5% R+1Morgan 93.2% R+44Morrow 97.5% R+52Muskingum 92.3% R+37Noble 91.7% R+58Ottawa 95.9% R+21Paulding 95.1% R+51Perry 97.4% R+42Pickaway 93.7% R+45Pike 96.0% R+38Portage 91.4% R+10Preble 97.3% R+56Putnam 94.9% R+67Richland 86.9% R+39Ross 90.3% R+29Sandusky 90.5% R+24Scioto 94.4% R+38Seneca 94.1% R+33Shelby 94.4% R+63Stark 88.4% R+18Summit 79.6% D+9Trumbull 88.7% R+7Tuscarawas 97.0% R+38Union 92.0% R+40Van Wert 96.5% R+59Vinton 97.1% R+48Warren 89.3% R+39Washington 96.2% R+44Wayne 95.0% R+36Williams 95.6% R+47Wood 92.3% R+9Wyandot 97.2% R+502020rho 0.79Adams 97.0% R+64Allen 81.9% R+40Ashland 96.4% R+50Ashtabula 92.3% R+24Athens 91.0% D+15Auglaize 96.1% R+63Belmont 93.1% R+44Brown 97.1% R+58Butler 83.0% R+23Carroll 96.9% R+54Champaign 94.0% R+48Clark 86.2% R+24Clermont 94.4% R+37Clinton 93.9% R+53Columbiana 94.3% R+46Coshocton 96.7% R+50Crawford 96.3% R+52Cuyahoga 61.4% D+34Darke 97.2% R+65Defiance 90.1% R+37Delaware 85.7% R+7Erie 84.6% R+12Fairfield 86.0% R+24Fayette 93.1% R+52Franklin 65.0% D+31Fulton 92.8% R+40Gallia 93.5% R+56Geauga 96.0% R+23Greene 84.6% R+20Guernsey 94.9% R+49Hamilton 66.6% D+16Hancock 92.2% R+38Hardin 95.4% R+53Harrison 95.1% R+53Henry 92.9% R+44Highland 95.6% R+61Hocking 96.3% R+43Holmes 98.3% R+69Huron 94.9% R+42Jackson 96.5% R+55Jefferson 90.9% R+39Knox 95.5% R+44Lake 90.1% R+14Lawrence 95.2% R+46Licking 90.7% R+27Logan 94.1% R+56Lorain 84.1% R+2Lucas 71.3% D+17Madison 89.6% R+42Mahoning 78.4% R+2Marion 89.2% R+39Medina 94.5% R+24Meigs 97.0% R+54Mercer 96.6% R+66Miami 93.3% R+45Monroe 97.1% R+55Montgomery 71.9% D+2Morgan 92.4% R+49Morrow 96.0% R+55Muskingum 91.4% R+40Noble 92.2% R+63Ottawa 94.7% R+24Paulding 95.2% R+52Perry 96.9% R+50Pickaway 93.0% R+48Pike 95.6% R+49Portage 89.7% R+13Preble 96.6% R+58Putnam 94.3% R+66Richland 86.2% R+40Ross 90.2% R+36Sandusky 89.8% R+28Scioto 94.0% R+43Seneca 92.5% R+35Shelby 93.7% R+64Stark 87.1% R+19Summit 77.7% D+10Trumbull 87.8% R+11Tuscarawas 96.5% R+41Union 90.3% R+32Van Wert 95.8% R+58Vinton 97.8% R+55Warren 87.3% R+31Washington 95.7% R+41Wayne 94.4% R+38Williams 94.5% R+47Wood 90.8% R+8Wyandot 96.4% R+512024rho 0.82Adams 96.4% R+66Allen 80.0% R+44Ashland 94.7% R+50Ashtabula 88.6% R+29Athens 89.7% D+11Auglaize 94.6% R+65Belmont 90.9% R+48Brown 95.2% R+62Butler 75.8% R+27Carroll 94.6% R+55Champaign 92.0% R+51Clark 82.4% R+30Clermont 91.6% R+36Clinton 92.1% R+55Columbiana 92.6% R+49Coshocton 94.7% R+53Crawford 95.1% R+53Cuyahoga 57.7% D+32Darke 95.1% R+66Defiance 86.7% R+40Delaware 79.9% R+7Erie 80.8% R+14Fairfield 81.5% R+24Fayette 91.2% R+56Franklin 59.0% D+29Fulton 89.2% R+43Gallia 92.9% R+60Geauga 93.2% R+24Greene 82.0% R+20Guernsey 93.8% R+52Hamilton 63.2% D+15Hancock 88.7% R+39Hardin 93.0% R+55Harrison 94.3% R+56Henry 90.4% R+47Highland 95.2% R+64Hocking 94.9% R+45Holmes 97.9% R+70Huron 91.7% R+44Jackson 95.7% R+58Jefferson 89.4% R+44Knox 93.6% R+45Lake 85.5% R+14Lawrence 94.0% R+51Licking 85.7% R+30Logan 91.9% R+57Lorain 78.0% R+6Lucas 68.2% D+13Madison 86.7% R+44Mahoning 74.9% R+9Marion 87.0% R+42Medina 92.0% R+25Meigs 96.2% R+57Mercer 94.9% R+67Miami 90.4% R+46Monroe 95.3% R+60Montgomery 68.4% D+0Morgan 90.5% R+54Morrow 94.0% R+56Muskingum 90.8% R+44Noble 92.2% R+65Ottawa 92.0% R+25Paulding 90.8% R+57Perry 95.8% R+55Pickaway 91.1% R+49Pike 94.9% R+54Portage 86.5% R+16Preble 95.5% R+60Putnam 92.1% R+69Richland 84.6% R+43Ross 88.7% R+40Sandusky 84.4% R+31Scioto 92.9% R+48Seneca 89.6% R+38Shelby 92.0% R+65Stark 84.5% R+22Summit 74.0% D+7Trumbull 85.2% R+17Tuscarawas 93.5% R+44Union 85.2% R+30Van Wert 93.0% R+59Vinton 96.0% R+59Warren 82.7% R+32Washington 93.9% R+44Wayne 93.3% R+40Williams 91.7% R+49Wood 87.1% R+10Wyandot 94.6% R+52
White-alone share and the presidential vote, 2008 to 2024The Republican margin runs higher where white-alone share is higher: rank correlation 0.45 in 2008 against 0.82 in 2024; 4 of the 5 elections measured are drawn.Source: U.S. Census Bureau · as of 2026-09 · Download this chart
The numbers behind this figure, as a table
White-alone share and the presidential vote, 2008 to 2024
ElectionSpearman rhoCounties
2008rho 0.4588
2016rho 0.7488
2020rho 0.7988
2024rho 0.8288
Every election measured, drawn or not
ElectionMeasure yearCountiesSpearman rhoIn the figure above
20082009880.45Drawn
20122012880.49Not drawn
20162016880.74Drawn
20202020880.79Drawn
20242024880.82Drawn

The measure, county by county

Share white alone in 2024, in five steps of one ink from the lowest counties to the highest. No party color: this map draws a measure, not a vote.
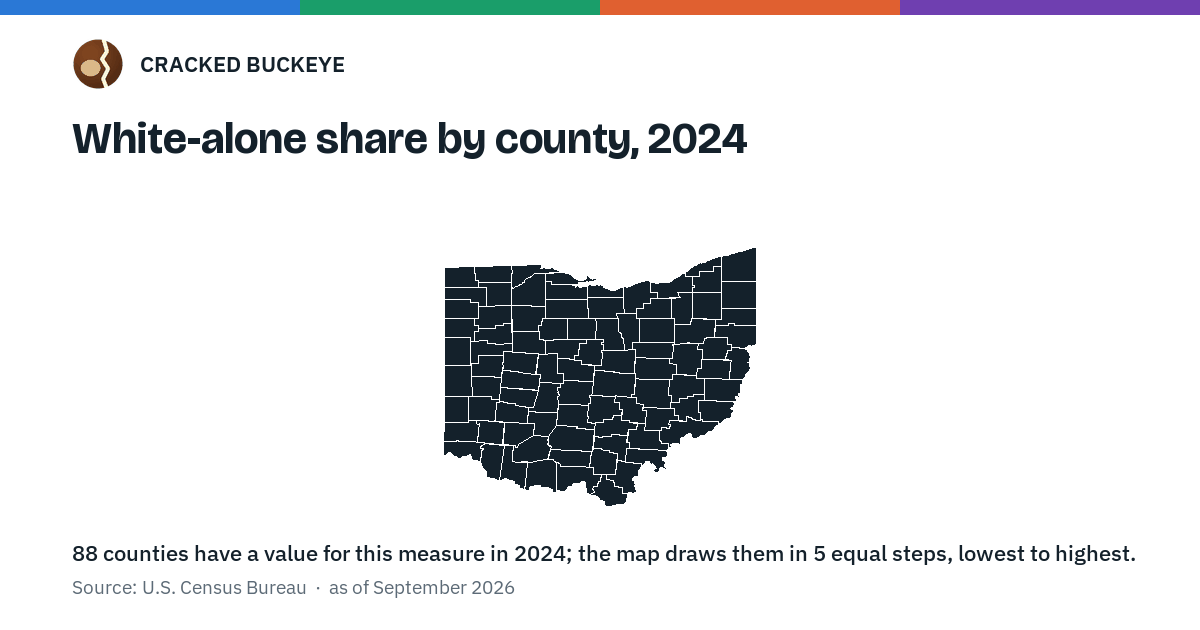
White-alone share by county, 202488 counties have a value for this measure in 2024; the map draws them in 5 equal steps, lowest to highest.Adams County: 96.4% (highest fifth)Allen County: 80.0% (lowest fifth)Ashland County: 94.7% (highest fifth)Ashtabula County: 88.6% (second fifth)Athens County: 89.7% (second fifth)Auglaize County: 94.6% (fourth fifth)Belmont County: 90.9% (middle fifth)Brown County: 95.2% (highest fifth)Butler County: 75.8% (lowest fifth)Carroll County: 94.6% (fourth fifth)Champaign County: 92.0% (middle fifth)Clark County: 82.4% (lowest fifth)Clermont County: 91.6% (middle fifth)Clinton County: 92.1% (middle fifth)Columbiana County: 92.6% (fourth fifth)Coshocton County: 94.7% (highest fifth)Crawford County: 95.1% (highest fifth)Cuyahoga County: 57.7% (lowest fifth)Darke County: 95.1% (highest fifth)Defiance County: 86.7% (second fifth)Delaware County: 79.9% (lowest fifth)Erie County: 80.8% (lowest fifth)Fairfield County: 81.5% (lowest fifth)Fayette County: 91.2% (middle fifth)Franklin County: 59.0% (lowest fifth)Fulton County: 89.2% (second fifth)Gallia County: 92.9% (fourth fifth)Geauga County: 93.2% (fourth fifth)Greene County: 82.0% (lowest fifth)Guernsey County: 93.8% (fourth fifth)Hamilton County: 63.2% (lowest fifth)Hancock County: 88.7% (second fifth)Hardin County: 93.0% (fourth fifth)Harrison County: 94.3% (fourth fifth)Henry County: 90.4% (middle fifth)Highland County: 95.2% (highest fifth)Hocking County: 94.9% (highest fifth)Holmes County: 97.9% (highest fifth)Huron County: 91.7% (middle fifth)Jackson County: 95.7% (highest fifth)Jefferson County: 89.4% (second fifth)Knox County: 93.6% (fourth fifth)Lake County: 85.5% (second fifth)Lawrence County: 94.0% (fourth fifth)Licking County: 85.7% (second fifth)Logan County: 91.9% (middle fifth)Lorain County: 78.0% (lowest fifth)Lucas County: 68.2% (lowest fifth)Madison County: 86.7% (second fifth)Mahoning County: 74.9% (lowest fifth)Marion County: 87.0% (second fifth)Medina County: 92.0% (middle fifth)Meigs County: 96.2% (highest fifth)Mercer County: 94.9% (highest fifth)Miami County: 90.4% (second fifth)Monroe County: 95.3% (highest fifth)Montgomery County: 68.4% (lowest fifth)Morgan County: 90.5% (middle fifth)Morrow County: 94.0% (fourth fifth)Muskingum County: 90.8% (middle fifth)Noble County: 92.2% (fourth fifth)Ottawa County: 92.0% (middle fifth)Paulding County: 90.8% (middle fifth)Perry County: 95.8% (highest fifth)Pickaway County: 91.1% (middle fifth)Pike County: 94.9% (highest fifth)Portage County: 86.5% (second fifth)Preble County: 95.5% (highest fifth)Putnam County: 92.1% (middle fifth)Richland County: 84.6% (second fifth)Ross County: 88.7% (second fifth)Sandusky County: 84.4% (lowest fifth)Scioto County: 92.9% (fourth fifth)Seneca County: 89.6% (second fifth)Shelby County: 92.0% (middle fifth)Stark County: 84.5% (lowest fifth)Summit County: 74.0% (lowest fifth)Trumbull County: 85.2% (second fifth)Tuscarawas County: 93.5% (fourth fifth)Union County: 85.2% (second fifth)Van Wert County: 93.0% (fourth fifth)Vinton County: 96.0% (highest fifth)Warren County: 82.7% (lowest fifth)Washington County: 93.9% (fourth fifth)Wayne County: 93.3% (fourth fifth)Williams County: 91.7% (middle fifth)Wood County: 87.1% (second fifth)Wyandot County: 94.6% (fourth fifth)2024
White-alone share by county, 202488 counties have a value for this measure in 2024; the map draws them in 5 equal steps, lowest to highest.Source: U.S. Census Bureau · as of 2026-09 · Download this chart
The numbers behind this figure, as a table
White-alone share by county, 2024
CountyShare white alone
Adams96.4%
Allen80.0%
Ashland94.7%
Ashtabula88.6%
Athens89.7%
Auglaize94.6%
Belmont90.9%
Brown95.2%
Butler75.8%
Carroll94.6%
Champaign92.0%
Clark82.4%
Clermont91.6%
Clinton92.1%
Columbiana92.6%
Coshocton94.7%
Crawford95.1%
Cuyahoga57.7%
Darke95.1%
Defiance86.7%
Delaware79.9%
Erie80.8%
Fairfield81.5%
Fayette91.2%
Franklin59.0%
Fulton89.2%
Gallia92.9%
Geauga93.2%
Greene82.0%
Guernsey93.8%
Hamilton63.2%
Hancock88.7%
Hardin93.0%
Harrison94.3%
Henry90.4%
Highland95.2%
Hocking94.9%
Holmes97.9%
Huron91.7%
Jackson95.7%
Jefferson89.4%
Knox93.6%
Lake85.5%
Lawrence94.0%
Licking85.7%
Logan91.9%
Lorain78.0%
Lucas68.2%
Madison86.7%
Mahoning74.9%
Marion87.0%
Medina92.0%
Meigs96.2%
Mercer94.9%
Miami90.4%
Monroe95.3%
Montgomery68.4%
Morgan90.5%
Morrow94.0%
Muskingum90.8%
Noble92.2%
Ottawa92.0%
Paulding90.8%
Perry95.8%
Pickaway91.1%
Pike94.9%
Portage86.5%
Preble95.5%
Putnam92.1%
Richland84.6%
Ross88.7%
Sandusky84.4%
Scioto92.9%
Seneca89.6%
Shelby92.0%
Stark84.5%
Summit74.0%
Trumbull85.2%
Tuscarawas93.5%
Union85.2%
Van Wert93.0%
Vinton96.0%
Warren82.7%
Washington93.9%
Wayne93.3%
Williams91.7%
Wood87.1%
Wyandot94.6%

The counties at each end

The five counties highest on the measure and the five lowest, with what each one voted in 2024.

CountyEndShare white alonePresidential margin, 2024
Holmes CountyHighest on this measure97.9%R+69.7
Adams CountyHighest on this measure96.4%R+66.1
Meigs CountyHighest on this measure96.2%R+57.4
Vinton CountyHighest on this measure96.0%R+59.0
Perry CountyHighest on this measure95.8%R+54.9
Cuyahoga CountyLowest on this measure57.7%D+31.7
Franklin CountyLowest on this measure59.0%D+28.7
Hamilton CountyLowest on this measure63.2%D+15.0
Lucas CountyLowest on this measure68.2%D+12.7
Montgomery CountyLowest on this measure68.4%D+0.5

What this does not say

This is a pattern across counties, not a fact about any voter.

County measures mostly rise with county size, so the partial figure holds log population fixed; the figure without Cuyahoga and Franklin shows whether the two largest counties carry the pattern on their own.

Derived as a ratio of ACS component estimates; no margin of error is propagated through the ratio.

The decennial count of the same share stops at 2020, four years from this election, so the American Community Survey five-year estimate is the measure drawn here.

Sources

The measure's own source and the election results this site holds, which every figure above is drawn from.

  1. American Community Survey 5-year estimates, county · U.S. Census Bureau · accessed 2026-09
  2. Presidential results by county, and Ohio's statewide results: Ohio in presidential elections, where every year names its own source.

Cite and data

Cite this page as:

Cracked Buckeye (Open Shower Co), "White-alone share and the presidential vote", https://crackedbuckeye.com/insights/white-alone-share/, built 2026-09-22, accessed [date].

Machine-readable: /api/politics/insights/white-alone-share.json (open JSON, CC BY 4.0 for the compilation; the underlying records keep their own terms) · How to cite · Report a correction · Built 2026-09-22

This page has a JSON twin: /api/politics/insights/white-alone-share.json — the record itself, with every statistic on this page and the figure specs behind the pictures.

Every published insight