Insights
What moves with the vote
Measures this atlas already holds, set against how Ohio's 88 counties voted for president. Each one is published whether the pattern holds or not, with the figure that was measured, the counties at each end, and what it does not say.
This is a pattern across counties, not a fact about any voter.
8 published insights
Spearman rho is the rank correlation across the counties measured; the partial figure holds log population fixed, because most county measures rise with county size.
-
Adult smoking and the presidential vote
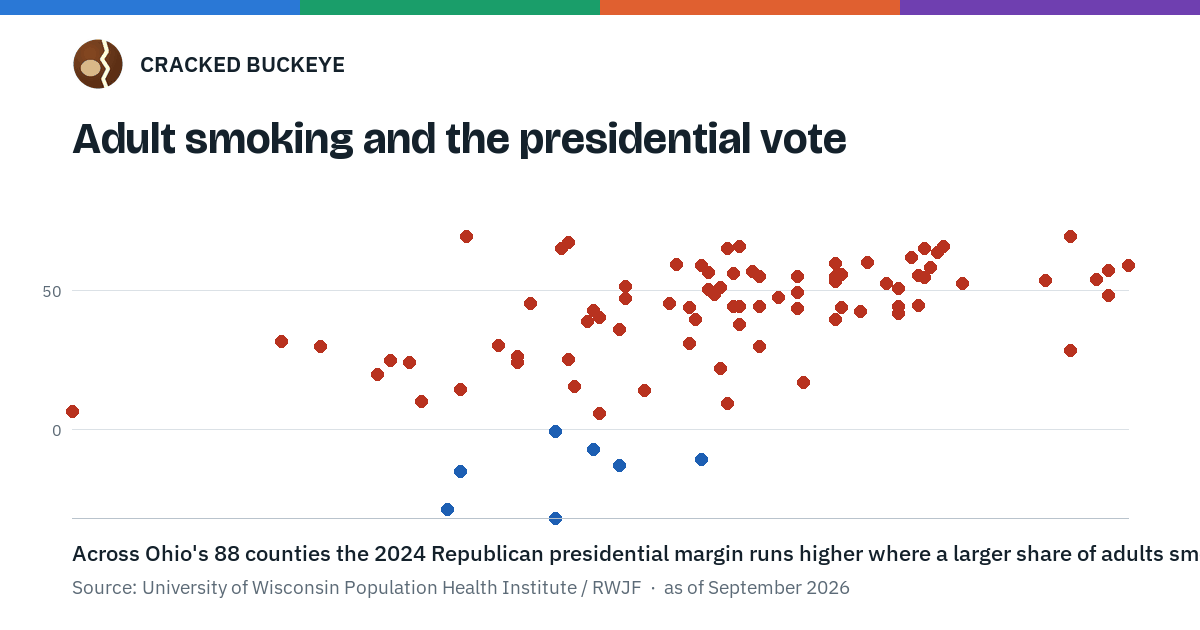
Across Ohio's 88 counties the 2024 Republican presidential margin runs higher where a larger share of adults smokes (Spearman rho 0.56; partial rho 0.22 with log population held fixed; 0.54 without Cuyahoga and Franklin; n = 88).
Spearman rho 0.56 · partial 0.22 · n = 88 · measure year 2024
Adult smoking and the presidential voteAcross Ohio's 88 counties the 2024 Republican presidential margin runs higher where a larger share of adults smokes (Spearman rho 0.56; partial rho 0.22 with log population held fixed; 0.54 without Cuyahoga and Franklin; n = 88).Source: University of Wisconsin Population Health Institute / RWJF · as of 2026-09 · Download this chart The numbers behind this figure, as a table
Adult smoking and the presidential vote County Adult smoking (County Health Rankings), 2024 Presidential margin, 2024 (R minus D, points) adams 24.8% R+66.1 allen 21.9% R+44.5 ashland 21.1% R+50.4 ashtabula 26.8% R+28.6 athens 21.0% D+10.8 auglaize 18.8% R+65.1 belmont 22.2% R+47.6 brown 24.3% R+61.8 butler 18.1% R+26.5 carroll 22.5% R+55.2 champaign 21.3% R+51.2 clark 21.9% R+29.8 clermont 19.7% R+36.1 clinton 21.9% R+55.1 columbiana 22.5% R+49.4 coshocton 25.1% R+52.6 crawford 23.1% R+53.4 Cuyahoga 18.7% D+31.7 darke 21.6% R+65.8 defiance 19.4% R+40.2 delaware 11.1% R+6.7 erie 20.1% R+14.3 fairfield 18.1% R+24.3 fayette 24.4% R+55.6 Franklin 17.0% D+28.7 fulton 19.3% R+42.8 gallia 23.1% R+59.8 geauga 16.4% R+24.3 greene 15.9% R+20.0 guernsey 23.9% R+52.4 hamilton 17.2% D+15.0 hancock 19.2% R+38.9 hardin 23.1% R+55.2 harrison 23.2% R+55.7 henry 19.8% R+47.1 highland 24.7% R+63.7 hocking 24.4% R+44.6 holmes 26.8% R+69.7 huron 21.6% R+44.4 jackson 24.6% R+58.4 jefferson 24.1% R+44.4 knox 20.5% R+45.3 lake 17.2% R+14.5 lawrence 24.1% R+50.9 licking 17.8% R+30.3 logan 21.1% R+56.7 lorain 19.4% R+5.8 lucas 19.7% D+12.7 madison 20.8% R+44.1 mahoning 21.4% R+9.5 marion 24.1% R+41.7 medina 16.1% R+25.0 meigs 27.4% R+57.4 mercer 18.9% R+67.2 miami 18.3% R+45.5 monroe 23.6% R+60.3 montgomery 18.7% D+0.5 morgan 26.4% R+53.6 morrow 21.5% R+56.2 muskingum 21.5% R+44.3 noble 24.5% R+65.1 ottawa 18.9% R+25.3 paulding 21.8% R+56.8 perry 24.5% R+54.9 pickaway 21.2% R+49.0 pike 27.2% R+54.0 portage 19.0% R+15.7 preble 20.6% R+59.6 putnam 17.3% R+69.4 richland 23.5% R+42.7 ross 23.1% R+39.7 sandusky 20.8% R+31.1 scioto 27.4% R+48.2 seneca 21.6% R+37.9 shelby 21.4% R+65.3 stark 21.3% R+22.1 summit 19.3% D+7.0 trumbull 22.6% R+16.9 tuscarawas 22.5% R+43.6 union 15.0% R+29.9 van-wert 21.0% R+59.0 vinton 27.7% R+59.0 warren 14.4% R+31.8 washington 23.2% R+44.1 wayne 20.9% R+39.6 williams 21.2% R+48.7 wood 16.6% R+10.3 wyandot 19.8% R+51.6 -
Bachelor's-degree share and the presidential vote
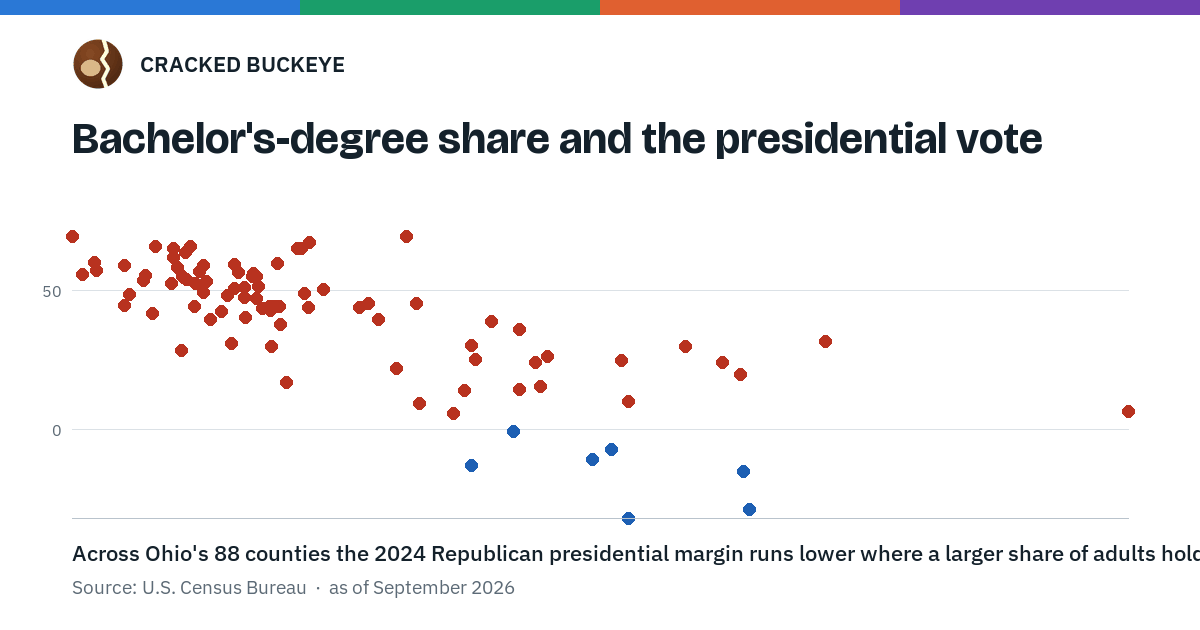
Across Ohio's 88 counties the 2024 Republican presidential margin runs lower where a larger share of adults holds a bachelor's degree (Spearman rho -0.72; partial rho -0.29 with log population held fixed; -0.70 without Cuyahoga and Franklin; n = 88).
Spearman rho -0.72 · partial -0.29 · n = 88 · measure year 2024
-
Health-based drinking water violations and the presidential vote
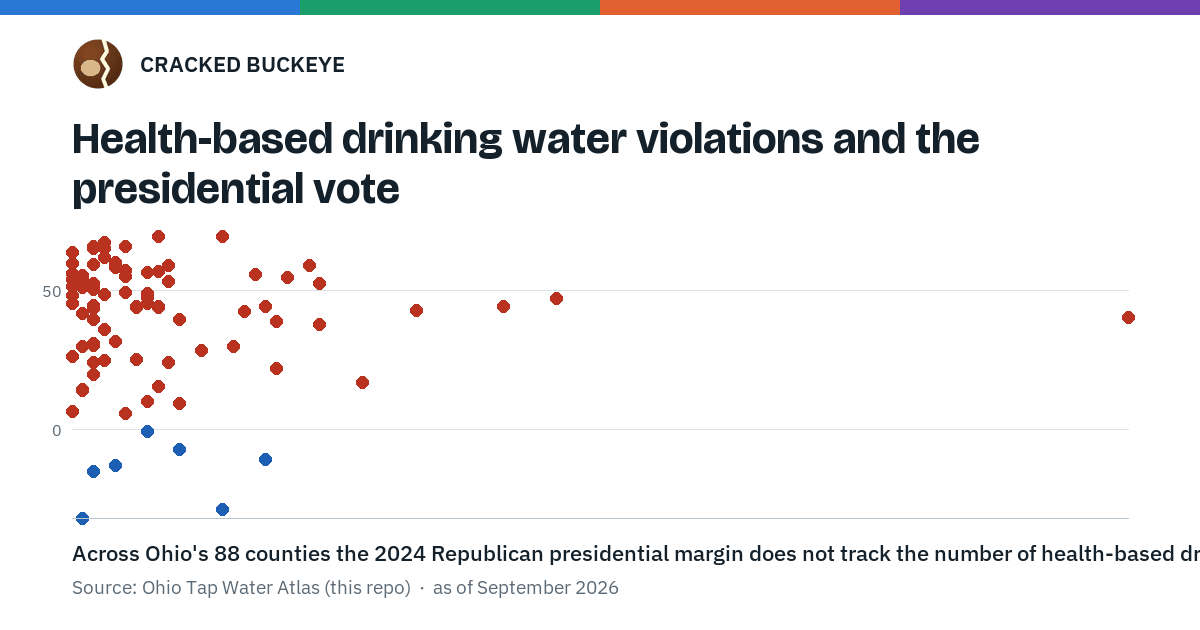
Across Ohio's 88 counties the 2024 Republican presidential margin does not track the number of health-based drinking water violations the atlas recorded over the past fifteen years (Spearman rho -0.12; partial rho -0.15 with log population held fixed; -0.14 without Cuyahoga and Franklin; n = 88).
Spearman rho -0.12 · partial -0.15 · n = 88 · measure year 2026
Health-based drinking water violations and the presidential voteAcross Ohio's 88 counties the 2024 Republican presidential margin does not track the number of health-based drinking water violations the atlas recorded over the past fifteen years (Spearman rho -0.12; partial rho -0.15 with log population held fixed; -0.14 without Cuyahoga and Franklin; n = 88).Source: Ohio Tap Water Atlas (this repo) · as of 2026-09 · Download this chart The numbers behind this figure, as a table
Health-based drinking water violations and the presidential vote County Health-based drinking water violations (trailing ~15yr), 2026 Presidential margin, 2024 (R minus D, points) adams 2 R+66.1 allen 8 R+44.5 ashland 2 R+50.4 ashtabula 12 R+28.6 athens 18 D+10.8 auglaize 2 R+65.1 belmont 7 R+47.6 brown 3 R+61.8 butler 0 R+26.5 carroll 5 R+55.2 champaign 1 R+51.2 clark 15 R+29.8 clermont 3 R+36.1 clinton 1 R+55.1 columbiana 5 R+49.4 coshocton 2 R+52.6 crawford 9 R+53.4 Cuyahoga 1 D+31.7 darke 5 R+65.8 defiance 98 R+40.2 delaware 0 R+6.7 erie 1 R+14.3 fairfield 2 R+24.3 fayette 1 R+55.6 Franklin 14 D+28.7 fulton 32 R+42.8 gallia 0 R+59.8 geauga 9 R+24.3 greene 2 R+20.0 guernsey 23 R+52.4 hamilton 2 D+15.0 hancock 19 R+38.9 hardin 5 R+55.2 harrison 17 R+55.7 henry 45 R+47.1 highland 0 R+63.7 hocking 2 R+44.6 holmes 8 R+69.7 huron 6 R+44.4 jackson 4 R+58.4 jefferson 18 R+44.4 knox 0 R+45.3 lake 1 R+14.5 lawrence 2 R+50.9 licking 2 R+30.3 logan 7 R+56.7 lorain 5 R+5.8 lucas 4 D+12.7 madison 8 R+44.1 mahoning 10 R+9.5 marion 1 R+41.7 medina 3 R+25.0 meigs 5 R+57.4 mercer 3 R+67.2 miami 7 R+45.5 monroe 4 R+60.3 montgomery 7 D+0.5 morgan 1 R+53.6 morrow 0 R+56.2 muskingum 40 R+44.3 noble 3 R+65.1 ottawa 6 R+25.3 paulding 8 R+56.8 perry 20 R+54.9 pickaway 7 R+49.0 pike 0 R+54.0 portage 8 R+15.7 preble 2 R+59.6 putnam 14 R+69.4 richland 16 R+42.7 ross 2 R+39.7 sandusky 2 R+31.1 scioto 0 R+48.2 seneca 23 R+37.9 shelby 2 R+65.3 stark 19 R+22.1 summit 10 D+7.0 trumbull 27 R+16.9 tuscarawas 2 R+43.6 union 1 R+29.9 van-wert 9 R+59.0 vinton 22 R+59.0 warren 4 R+31.8 washington 6 R+44.1 wayne 10 R+39.6 williams 3 R+48.7 wood 7 R+10.3 wyandot 0 R+51.6 -
People moving in, per 1,000 residents, and the presidential vote
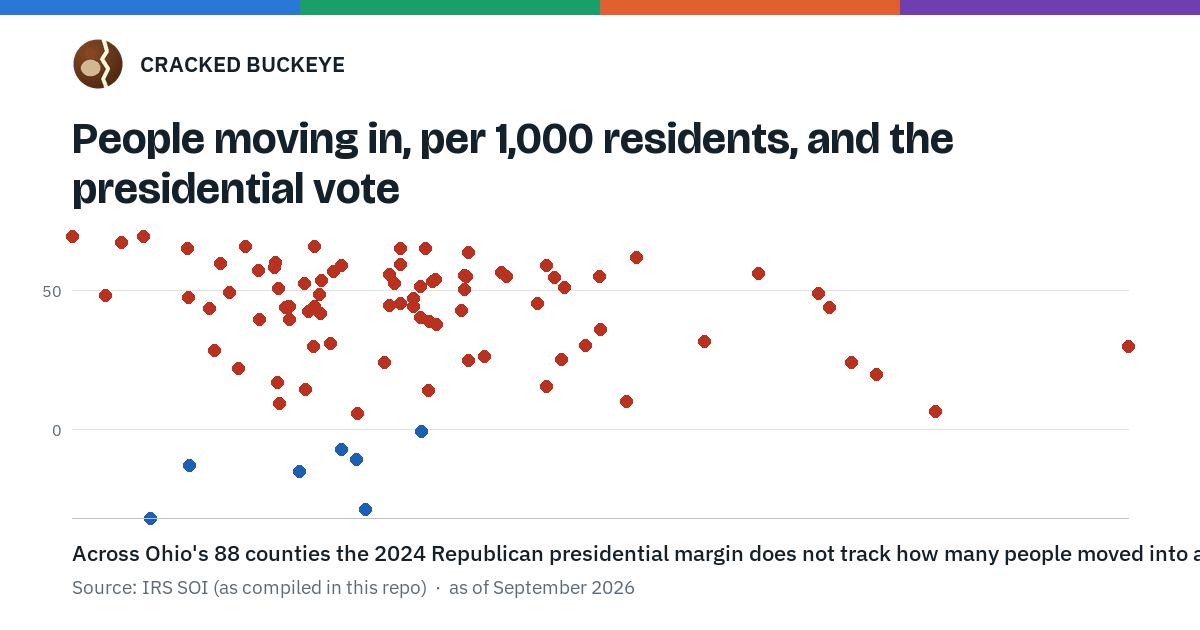
Across Ohio's 88 counties the 2024 Republican presidential margin does not track how many people moved into a county per 1,000 residents in 2022 (Spearman rho -0.11; partial rho -0.21 with log population held fixed; -0.15 without Cuyahoga and Franklin; n = 88).
Spearman rho -0.11 · partial -0.21 · n = 88 · measure year 2022
People moving in, per 1,000 residents, and the presidential voteAcross Ohio's 88 counties the 2024 Republican presidential margin does not track how many people moved into a county per 1,000 residents in 2022 (Spearman rho -0.11; partial rho -0.21 with log population held fixed; -0.15 without Cuyahoga and Franklin; n = 88).Source: IRS SOI (as compiled in this repo) · as of 2026-09 · Download this chart The numbers behind this figure, as a table
People moving in, per 1,000 residents, and the presidential vote County People moving in per 1,000 residents (IRS migration, 2022), 2022 Presidential margin, 2024 (R minus D, points) adams 34.4 R+66.1 allen 34.3 R+44.5 ashland 42.0 R+50.4 ashtabula 29.2 R+28.6 athens 36.5 D+10.8 auglaize 40.0 R+65.1 belmont 27.9 R+47.6 brown 50.9 R+61.8 butler 43.1 R+26.5 carroll 44.2 R+55.2 champaign 47.2 R+51.2 clark 34.3 R+29.8 clermont 49.0 R+36.1 clinton 49.0 R+55.1 columbiana 30.0 R+49.4 coshocton 33.9 R+52.6 crawford 40.4 R+53.4 Cuyahoga 25.9 D+31.7 darke 30.8 R+65.8 defiance 39.8 R+40.2 delaware 66.2 R+6.7 erie 40.2 R+14.3 fairfield 61.9 R+24.3 fayette 42.1 R+55.6 Franklin 37.0 D+28.7 fulton 41.9 R+42.8 gallia 29.5 R+59.8 geauga 37.9 R+24.3 greene 63.2 R+20.0 guernsey 38.5 R+52.4 hamilton 33.6 D+15.0 hancock 40.2 R+38.9 hardin 42.1 R+55.2 harrison 38.2 R+55.7 henry 39.4 R+47.1 highland 42.3 R+63.7 hocking 38.2 R+44.6 holmes 25.6 R+69.7 huron 39.5 R+44.4 jackson 32.3 R+58.4 jefferson 33.1 R+44.4 knox 38.8 R+45.3 lake 33.9 R+14.5 lawrence 32.5 R+50.9 licking 48.3 R+30.3 logan 44.0 R+56.7 lorain 36.6 R+5.8 lucas 27.9 D+12.7 madison 60.8 R+44.1 mahoning 32.6 R+9.5 marion 34.6 R+41.7 medina 42.2 R+25.0 meigs 31.5 R+57.4 mercer 24.5 R+67.2 miami 45.8 R+45.5 monroe 32.4 R+60.3 montgomery 39.8 D+0.5 morgan 34.7 R+53.6 morrow 57.2 R+56.2 muskingum 33.0 R+44.3 noble 27.8 R+65.1 ottawa 47.0 R+25.3 paulding 35.3 R+56.8 perry 46.7 R+54.9 pickaway 60.2 R+49.0 pike 40.6 R+54.0 portage 46.3 R+15.7 preble 38.8 R+59.6 putnam 21.9 R+69.4 richland 34.0 R+42.7 ross 33.1 R+39.7 sandusky 35.2 R+31.1 scioto 23.6 R+48.2 seneca 40.6 R+37.9 shelby 38.8 R+65.3 stark 30.4 R+22.1 summit 35.7 D+7.0 trumbull 32.4 R+16.9 tuscarawas 29.0 R+43.6 union 76.1 R+29.9 van-wert 35.8 R+59.0 vinton 46.2 R+59.0 warren 54.4 R+31.8 washington 32.8 R+44.1 wayne 31.5 R+39.6 williams 34.6 R+48.7 wood 50.4 R+10.3 wyandot 39.8 R+51.6 -
Population change 1950 to 1990 and the presidential vote
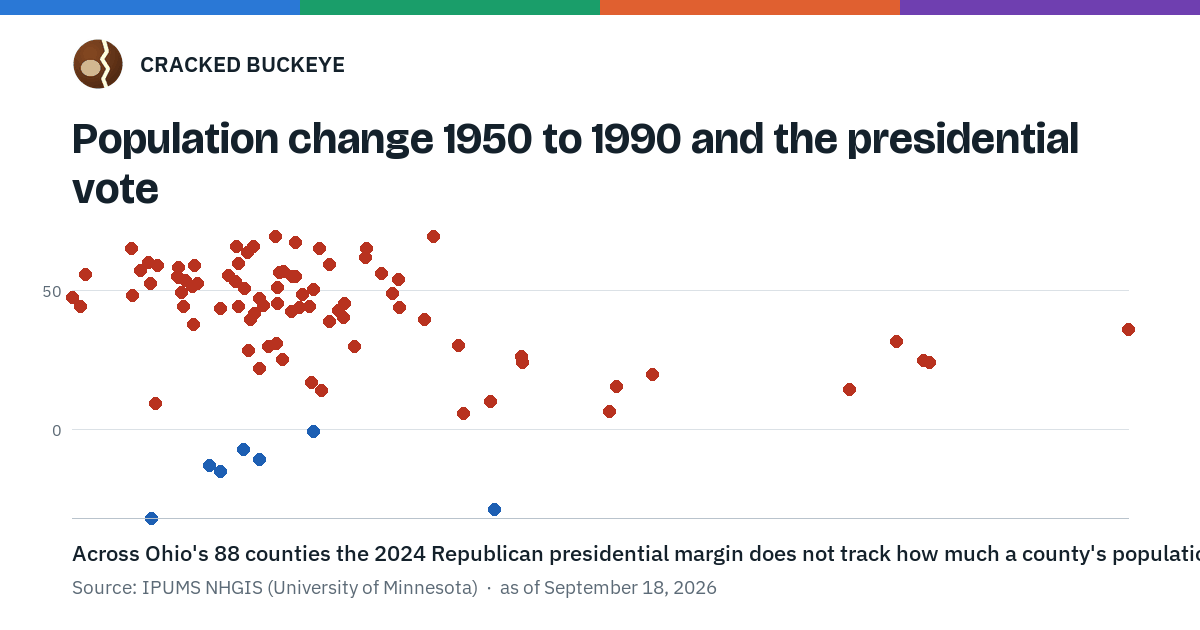
Across Ohio's 88 counties the 2024 Republican presidential margin does not track how much a county's population changed between 1950 and 1990 (Spearman rho -0.32; partial rho -0.06 with log population held fixed; -0.34 without Cuyahoga and Franklin; n = 88).
Spearman rho -0.32 · partial -0.06 · n = 88 · measure year 1990
Population change 1950 to 1990 and the presidential voteAcross Ohio's 88 counties the 2024 Republican presidential margin does not track how much a county's population changed between 1950 and 1990 (Spearman rho -0.32; partial rho -0.06 with log population held fixed; -0.34 without Cuyahoga and Franklin; n = 88).Source: IPUMS NHGIS (University of Minnesota) · as of 2026-09-18 · Download this chart The numbers behind this figure, as a table
Population change 1950 to 1990 and the presidential vote County Population change, 1950 to 1990 (percent), 1990 Presidential margin, 2024 (R minus D, points) adams 23.8% R+66.1 allen 24.5% R+44.5 ashland 43.8% R+50.4 ashtabula 26.8% R+28.6 athens 29.9% D+10.8 auglaize 45.5% R+65.1 belmont -19.0% R+47.6 brown 57.4% R+61.8 butler 98.0% R+26.5 carroll 39.3% R+55.2 champaign 34.4% R+51.2 clark 32.1% R+29.8 clermont 256.0% R+36.1 clinton 38.5% R+55.1 columbiana 9.5% R+49.4 coshocton 13.8% R+52.6 crawford 23.6% R+53.4 Cuyahoga 1.6% D+31.7 darke 28.3% R+65.8 defiance 51.8% R+40.2 delaware 121.0% R+6.7 erie 46.1% R+14.3 fairfield 98.5% R+24.3 fayette 21.8% R+55.6 Franklin 91.0% D+28.7 fulton 50.5% R+42.8 gallia 24.3% R+59.8 geauga 204.5% R+24.3 greene 132.2% R+20.0 guernsey 1.5% R+52.4 hamilton 19.7% D+15.0 hancock 48.0% R+38.9 hardin 8.5% R+55.2 harrison -15.6% R+55.7 henry 29.8% R+47.1 highland 26.7% R+63.7 hocking 30.8% R+44.6 holmes 75.1% R+69.7 huron 42.9% R+44.4 jackson 8.9% R+58.4 jefferson -16.8% R+44.4 knox 34.5% R+45.3 lake 183.6% R+14.5 lawrence 25.9% R+50.9 licking 81.6% R+30.3 logan 35.1% R+56.7 lorain 83.0% R+5.8 lucas 16.9% D+12.7 madison 66.2% R+44.1 mahoning 2.8% R+9.5 marion 28.7% R+41.7 medina 202.7% R+25.0 meigs -1.0% R+57.4 mercer 39.3% R+67.2 miami 52.0% R+45.5 monroe 0.9% R+60.3 montgomery 44.0% D+0.5 morgan 10.6% R+53.6 morrow 61.6% R+56.2 muskingum 10.1% R+44.3 noble -3.5% R+65.1 ottawa 35.8% R+25.3 paulding 36.2% R+56.8 perry 8.8% R+54.9 pickaway 64.4% R+49.0 pike 66.0% R+54.0 portage 122.9% R+15.7 preble 48.1% R+59.6 putnam 33.9% R+69.4 richland 38.1% R+42.7 ross 27.4% R+39.7 sandusky 34.4% R+31.1 scioto -3.1% R+48.2 seneca 12.8% R+37.9 shelby 57.7% R+65.3 stark 29.8% R+22.1 summit 25.6% D+7.0 trumbull 43.4% R+16.9 tuscarawas 19.6% R+43.6 union 54.5% R+29.9 van-wert 13.0% R+59.0 vinton 3.2% R+59.0 warren 195.8% R+31.8 washington 40.2% R+44.1 wayne 72.8% R+39.6 williams 41.0% R+48.7 wood 90.0% R+10.3 wyandot 12.5% R+51.6 -
Poverty rate and the presidential vote
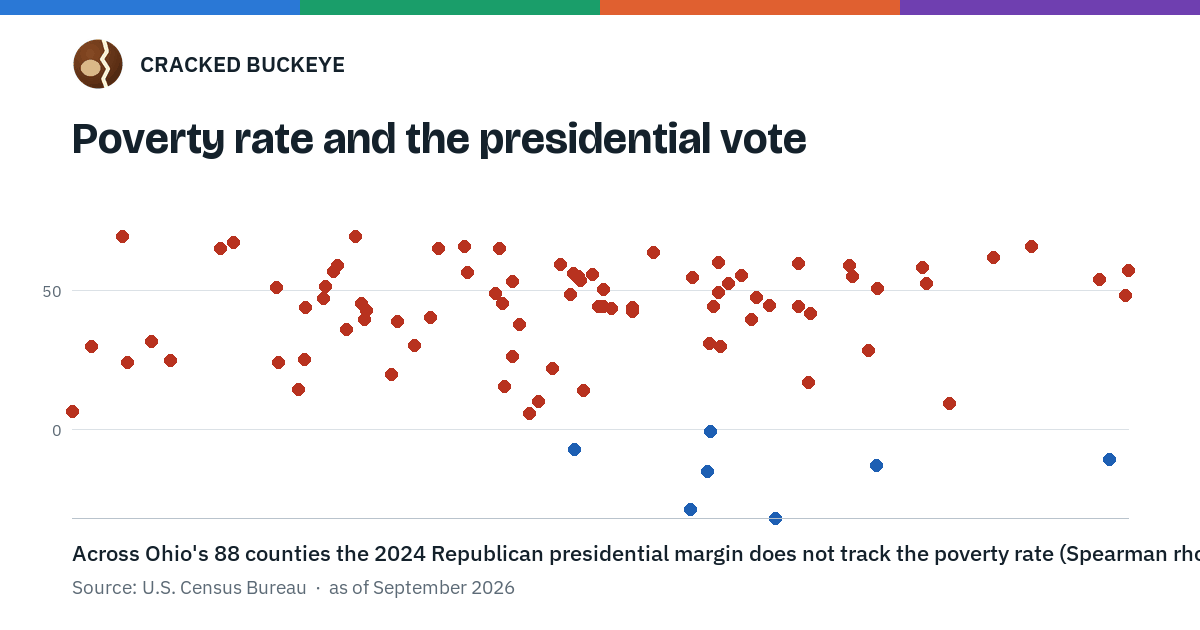
Across Ohio's 88 counties the 2024 Republican presidential margin does not track the poverty rate (Spearman rho 0.04; partial rho -0.06 with log population held fixed; 0.07 without Cuyahoga and Franklin; n = 88).
Spearman rho 0.04 · partial -0.06 · n = 88 · measure year 2024
Poverty rate and the presidential voteAcross Ohio's 88 counties the 2024 Republican presidential margin does not track the poverty rate (Spearman rho 0.04; partial rho -0.06 with log population held fixed; 0.07 without Cuyahoga and Franklin; n = 88).Source: U.S. Census Bureau · as of 2026-09 · Download this chart The numbers behind this figure, as a table
Poverty rate and the presidential vote County Share of the population below the poverty line, 2024 Presidential margin, 2024 (R minus D, points) adams 20.2% R+66.1 allen 13.3% R+44.5 ashland 13.3% R+50.4 ashtabula 17.6% R+28.6 athens 21.5% D+10.8 auglaize 7.1% R+65.1 belmont 15.8% R+47.6 brown 19.6% R+61.8 butler 11.8% R+26.5 carroll 12.9% R+55.2 champaign 8.0% R+51.2 clark 15.2% R+29.8 clermont 9.1% R+36.1 clinton 12.9% R+55.1 columbiana 15.2% R+49.4 coshocton 18.5% R+52.6 crawford 11.8% R+53.4 Cuyahoga 16.1% D+31.7 darke 11.0% R+65.8 defiance 10.5% R+40.2 delaware 4.7% R+6.7 erie 13.0% R+14.3 fairfield 8.0% R+24.3 fayette 15.5% R+55.6 Franklin 14.7% D+28.7 fulton 9.4% R+42.8 gallia 16.4% R+59.8 geauga 5.6% R+24.3 greene 9.8% R+20.0 guernsey 15.3% R+52.4 hamilton 15.0% D+15.0 hancock 9.9% R+38.9 hardin 17.3% R+55.2 harrison 13.1% R+55.7 henry 8.7% R+47.1 highland 14.1% R+63.7 hocking 16.0% R+44.6 holmes 9.3% R+69.7 huron 13.2% R+44.4 jackson 18.5% R+58.4 jefferson 16.5% R+44.4 knox 11.6% R+45.3 lake 8.3% R+14.5 lawrence 17.7% R+50.9 licking 10.2% R+30.3 logan 11.1% R+56.7 lorain 12.1% R+5.8 lucas 17.7% D+12.7 madison 8.5% R+44.1 mahoning 18.9% R+9.5 marion 16.6% R+41.7 medina 6.3% R+25.0 meigs 21.8% R+57.4 mercer 7.3% R+67.2 miami 9.4% R+45.5 monroe 15.2% R+60.3 montgomery 15.0% D+0.5 morgan 12.9% R+53.6 morrow 12.8% R+56.2 muskingum 15.1% R+44.3 noble 10.6% R+65.1 ottawa 8.4% R+25.3 paulding 8.9% R+56.8 perry 14.7% R+54.9 pickaway 11.5% R+49.0 pike 21.3% R+54.0 portage 11.7% R+15.7 preble 12.6% R+59.6 putnam 5.5% R+69.4 richland 13.8% R+42.7 ross 15.7% R+39.7 sandusky 15.0% R+31.1 scioto 21.8% R+48.2 seneca 11.9% R+37.9 shelby 11.6% R+65.3 stark 12.5% R+22.1 summit 12.8% D+7.0 trumbull 16.6% R+16.9 tuscarawas 13.4% R+43.6 union 5.0% R+29.9 van-wert 9.0% R+59.0 vinton 17.3% R+59.0 warren 6.0% R+31.8 washington 13.7% R+44.1 wayne 9.4% R+39.6 williams 12.7% R+48.7 wood 12.2% R+10.3 wyandot 8.8% R+51.6 -
Unemployment rate and the presidential vote
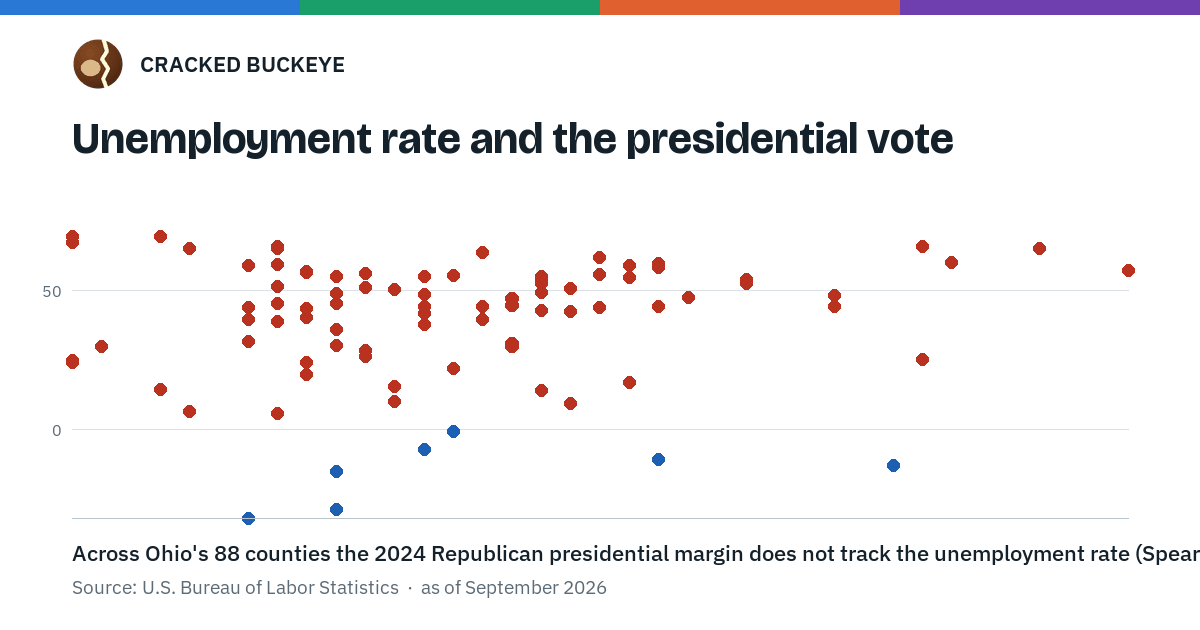
Across Ohio's 88 counties the 2024 Republican presidential margin does not track the unemployment rate (Spearman rho 0.12; partial rho -0.25 with log population held fixed; 0.10 without Cuyahoga and Franklin; n = 88).
Spearman rho 0.12 · partial -0.25 · n = 88 · measure year 2024
Unemployment rate and the presidential voteAcross Ohio's 88 counties the 2024 Republican presidential margin does not track the unemployment rate (Spearman rho 0.12; partial rho -0.25 with log population held fixed; 0.10 without Cuyahoga and Franklin; n = 88).Source: U.S. Bureau of Labor Statistics · as of 2026-09 · Download this chart The numbers behind this figure, as a table
Unemployment rate and the presidential vote County Unemp Rate, 2024 Presidential margin, 2024 (R minus D, points) adams 6.2% R+66.1 allen 4.5% R+44.5 ashland 4.4% R+50.4 ashtabula 4.3% R+28.6 athens 5.3% D+10.8 auglaize 3.7% R+65.1 belmont 5.4% R+47.6 brown 5.1% R+61.8 butler 4.3% R+26.5 carroll 4.9% R+55.2 champaign 4.3% R+51.2 clark 4.8% R+29.8 clermont 4.2% R+36.1 clinton 4.2% R+55.1 columbiana 4.9% R+49.4 coshocton 4.9% R+52.6 crawford 4.9% R+53.4 Cuyahoga 3.9% D+31.7 darke 4.0% R+65.8 defiance 4.1% R+40.2 delaware 3.7% R+6.7 erie 4.9% R+14.3 fairfield 4.1% R+24.3 fayette 4.6% R+55.6 Franklin 4.2% D+28.7 fulton 4.9% R+42.8 gallia 5.3% R+59.8 geauga 3.3% R+24.3 greene 4.1% R+20.0 guernsey 5.6% R+52.4 hamilton 4.2% D+15.0 hancock 4.0% R+38.9 hardin 4.5% R+55.2 harrison 5.1% R+55.7 henry 4.8% R+47.1 highland 4.7% R+63.7 hocking 4.8% R+44.6 holmes 3.3% R+69.7 huron 5.3% R+44.4 jackson 5.3% R+58.4 jefferson 5.9% R+44.4 knox 4.2% R+45.3 lake 3.6% R+14.5 lawrence 5.0% R+50.9 licking 4.2% R+30.3 logan 4.1% R+56.7 lorain 4.0% R+5.8 lucas 6.1% D+12.7 madison 3.9% R+44.1 mahoning 5.0% R+9.5 marion 4.5% R+41.7 medina 3.3% R+25.0 meigs 6.9% R+57.4 mercer 3.3% R+67.2 miami 4.0% R+45.5 monroe 6.3% R+60.3 montgomery 4.6% D+0.5 morgan 5.6% R+53.6 morrow 4.3% R+56.2 muskingum 4.7% R+44.3 noble 6.6% R+65.1 ottawa 6.2% R+25.3 paulding 4.1% R+56.8 perry 5.2% R+54.9 pickaway 4.2% R+49.0 pike 5.6% R+54.0 portage 4.4% R+15.7 preble 4.0% R+59.6 putnam 3.6% R+69.4 richland 5.0% R+42.7 ross 4.7% R+39.7 sandusky 4.8% R+31.1 scioto 5.9% R+48.2 seneca 4.5% R+37.9 shelby 4.0% R+65.3 stark 4.6% R+22.1 summit 4.5% D+7.0 trumbull 5.2% R+16.9 tuscarawas 4.1% R+43.6 union 3.4% R+29.9 van-wert 3.9% R+59.0 vinton 5.2% R+59.0 warren 3.9% R+31.8 washington 5.1% R+44.1 wayne 3.9% R+39.6 williams 4.5% R+48.7 wood 4.4% R+10.3 wyandot 4.0% R+51.6 -
White-alone share and the presidential vote
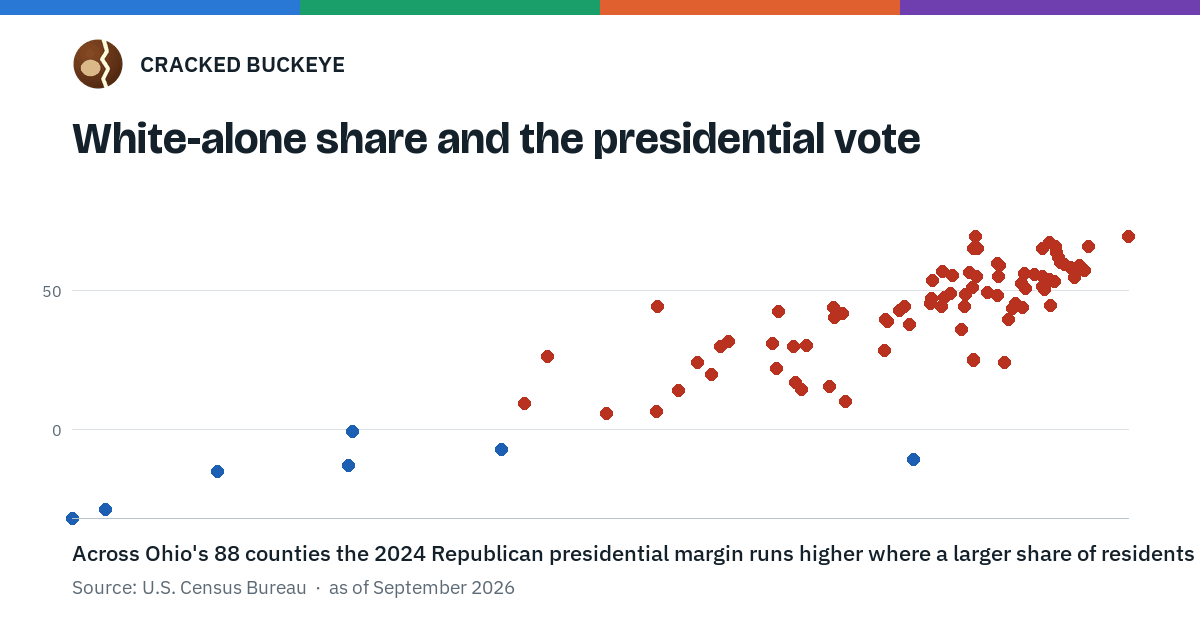
Across Ohio's 88 counties the 2024 Republican presidential margin runs higher where a larger share of residents is white alone (Spearman rho 0.82; partial rho 0.56 with log population held fixed; 0.81 without Cuyahoga and Franklin; n = 88).
Spearman rho 0.82 · partial 0.56 · n = 88 · measure year 2024
Cite and data
Cite this page as:
Cracked Buckeye (Open Shower Co), "What moves with the vote", https://crackedbuckeye.com/insights/, built 2026-09-22, accessed [date].
Machine-readable: /api/politics/insights.json (open JSON, CC BY 4.0 for the compilation; the underlying records keep their own terms) · How to cite · Report a correction · Built 2026-09-22
Every insight record, as JSON: /api/politics/insights.json