Deep dives · Jefferson County, Perry County, Seneca County, Mahoning County, Hamilton County, Washington County, Tuscarawas County, Guernsey County, Trumbull County, Portage County, Ashtabula County, Belmont County, Monroe County, Noble County
Landfills, dumps and injection wells
More than a third of the trash in Ohio's landfills comes from other states, and four in ten barrels of oil-field brine put into Ohio wells pay no fee.
- Published
At a glance
| Fact | Value |
|---|---|
| Waste taken by Ohio landfills, 2024 | 22.1 million tons, 36.8 percent from other states (Ohio EPA) |
| The same share in 2014 | 13.8 percent of all waste; 19.7 percent at public landfills, against 37.5 percent in 2024 |
| Where the imports go | Four landfills took 94 percent: Apex (Jefferson), WIN Waste (Seneca), Tunnel Hill (Perry), Carbon Limestone (Mahoning) |
| Where they come from | Mostly the Northeast by rail: New Jersey, Massachusetts, New York, Connecticut (2020) |
| Landfill space | About 38 years at the 2024 rate; 60 years without other states' trash |
| Old dumps | 3,041 in all 88 counties; 12 percent sit in the 1-percent floodplain |
| Coal ash | 33 ponds and landfills at nine power plants and one paper mill |
| Brine disposal wells | 227 listed as active; 34.3 million barrels injected in 2025 |
| Brine that paid no fee, 2025 | 39.6 percent, because the fee stops at a well's 500,000th barrel (R.C. 1509.22) |
| Pennsylvania's brine | 96 percent of what Ohio takes goes to four counties in the northeast corner |
Ohio buries two kinds of other people's waste. One is trash, which comes by train from the crowded Northeast and goes into a handful of large landfills. The other is brine, the salty water that comes up with oil and gas, which comes by truck from Ohio's own shale fields and from Pennsylvania and goes into deep disposal wells. Both flows end up mostly in eastern Ohio. This page follows each one from the records: who sends it, where it goes, what the state charges, and what the records cannot tell you.
All of it is on our map. Open Layers, then Utilities and sites, and turn on Landfills, dumps and waste sites or Injection wells. Coal ash ponds are under Energy.
Other states' trash
More than a third of what goes into Ohio's landfills is other states' trash
In 2024 Ohio's landfills took in 22,112,869 tons of waste. Of that, 8,145,263 tons (36.8 percent) came from other states. In 2014 the total was almost the same, 22,229,387 tons, but only 3,074,088 tons (13.8 percent) came from out of state (Ohio EPA Facility Data Reports, Table 7).
The 2014 total includes about 6.6 million tons at landfills that power plants and factories run for their own ash and waste. Most of those landfills are gone from the 2024 table. Leave them out and compare only the public landfills that take household and business trash, and the out-of-state share went from 19.7 percent to 37.5 percent. Either way, the trend is the same. Ohio's own trash at those landfills rose 8 percent in ten years. Other states' trash rose 165 percent.
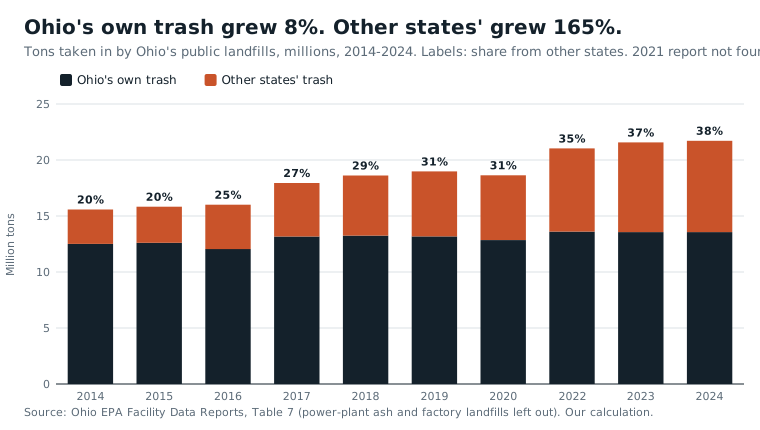
Nearly all of it goes to four landfills. Together they took 7,652,638 of the 8,145,263 imported tons in 2024 (94.0 percent), and 99.4 percent of the growth since 2014:
| Landfill | County | Tons from other states, 2024 | Share of its own intake |
|---|---|---|---|
| Apex Sanitary Landfill | Jefferson | 2,717,386 | 86.6% |
| WIN Waste (formerly Sunny Farms) | Seneca | 2,140,005 | 98.2% |
| Tunnel Hill Reclamation | Perry | 1,761,362 | 93.4% |
| Carbon Limestone | Mahoning | 1,033,885 | 68.1% |
The figures check against other sources. EPA's landfill gas database lists Apex taking 2,551,858 tons in 2022; Ohio EPA's 2022 report says 2,551,857 (EPA LMOP). News reports of 7.4 million tons imported in 2022 and of WIN Waste taking 2.3 million tons in 2023, 97 percent from out of state, also match Ohio EPA's reports (7,434,503 and 2,324,410 tons, 97.7 percent).
It comes by rail from the Northeast
Ohio EPA last published where its imported trash came from in 2020. New Jersey sent 2.04 million tons, Massachusetts 1.01 million, New York 958,942 and Connecticut 845,431. Of the 5.81 million tons that year, 83.6 percent came from those four states, 10.1 percent from Pennsylvania, and only 6.2 percent from the other four states that border Ohio.
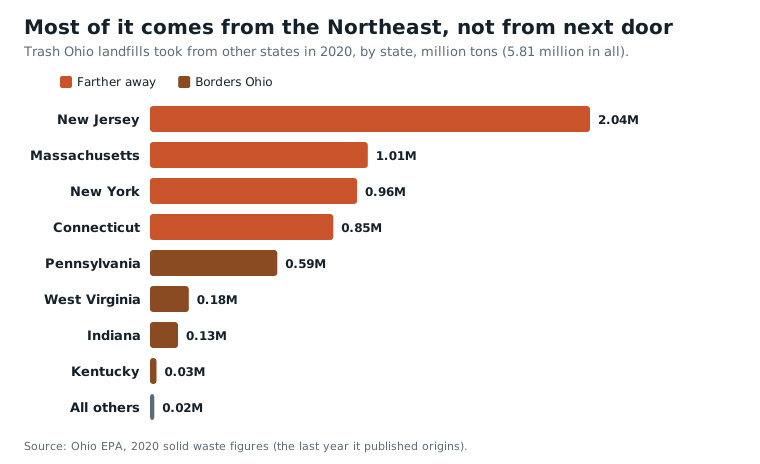
Ohio EPA's own 2020 fact sheet names Sunny Farms, Apex and Tunnel Hill as landfills that "receive long-haul waste via railway" (Ohio EPA). The 2024 report shows the same thing another way. All of Tunnel Hill's and WIN Waste's imported tons, and 92 percent of Apex's, came through a transfer station, which for these three means the rail yard, since Ohio EPA names them as rail landfills. Carbon Limestone, on the Pennsylvania line outside Youngstown, is different: nearly all of its imports came straight in by truck.
The sending states are short of landfill space of their own, and Ohio cannot shut the gate. The U.S. Supreme Court has ruled that a state may not ban other states' trash (Philadelphia v. New Jersey, 1978) or charge it a higher fee (Oregon Waste Systems v. Department of Environmental Quality, 1994).
Cheap gate fees do not explain it
A common explanation is that Ohio's landfills are cheap. We tested that. The 2024 report prints each landfill's posted gate fee, the price per ton at the scale house. Across the 30 public landfills that print a fee, the fee has no relation to how much out-of-state trash the landfill takes (a rank correlation of 0.06, where 0 means no relation and 1 a perfect one).
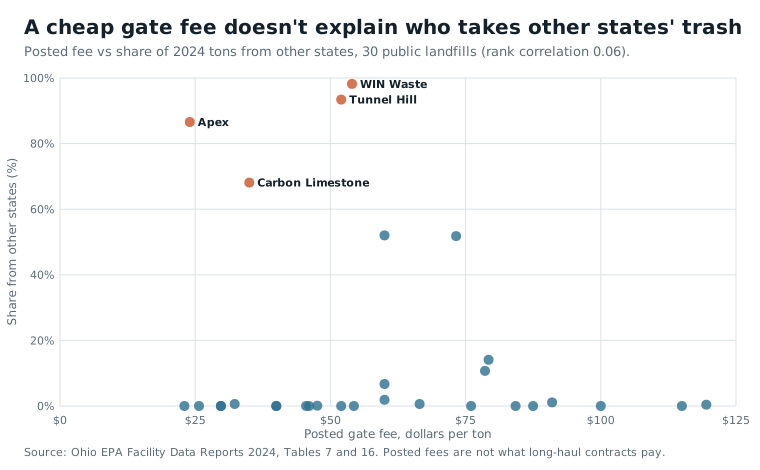
The importers post $24 (Apex), $35 (Carbon Limestone), $52 (Tunnel Hill) and $54 (WIN Waste), against a middle value of $54.35 for all 30. Apart from Apex, the cheapest gates in Ohio are public landfills that import nothing or almost nothing: Lake County at $23, Toledo's Hoffman Road at $25.70, Franklin County's (SWACO) and Hancock County's at $29.75, Wood County's at $32.30. A long-haul contract does not pay the posted price. What sets the importers apart in the records is the railway, not the price list.
What it means for the host counties
Three counties carry nearly all of it. Per resident in 2024, Perry County took 49.3 tons of other states' trash, Jefferson 42.6 and Seneca 39.1. Mahoning took 5.3 per resident, and every other county less than 2.
An Ohioan sends about 1.5 tons of trash a year to a landfill (2020). At that rate, Tunnel Hill's 1.76 million tons of imports equal 32 years of all Perry County's own trash, buried every year. For Jefferson the figure is 28 years and for Seneca 26.
Ohio sends some trash out, too: 1,331,983 tons in 2020, to Michigan, Kentucky, Indiana, Pennsylvania and West Virginia.
How much landfill room is left
"Thirty-eight years" is not a countdown
Ohio EPA reports that Ohio's landfills had 981,150,906 cubic yards of permitted space left at the end of 2024 and filled 25,705,020 cubic yards that year. Divide one by the other and you get 38.2 years. That figure has stayed between 32 and 38 years since 2014. It does not count down, because the space keeps growing.
From 2014 to 2024 Ohio's public landfills filled about 244 million cubic yards, and their remaining space still rose by 316 million. About 561 million cubic yards of new or expanded space came onto the books, or 2.3 yards permitted for every yard filled. Landfill space is a permit, not a hole of fixed size. Ohio EPA approves expansions at existing landfills, so the clock resets about as fast as it runs.
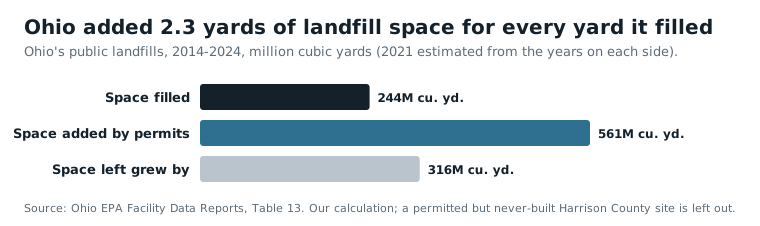
One permit explains the biggest single jump. Rumpke's landfill in Hamilton County went from 20,950,205 cubic yards left in 2018 to 121,693,451 in 2019, a rise of 100.7 million. That one expansion is larger than the whole statewide jump that year. Tunnel Hill shows the same thing on a smaller scale: it had 18.5 years left in 2018 and 44 in 2024, after it expanded.
Other states' trash used about 9.5 million cubic yards of space in 2024, 36.8 percent of the year's filling. Without it, the same space would last about 60 years instead of 38.
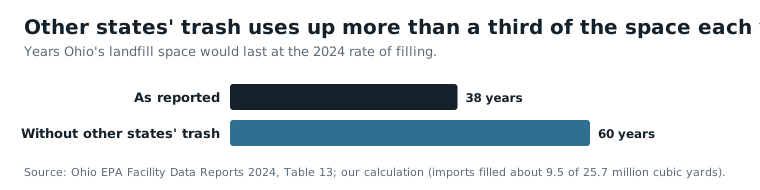
Fewest years left among the public landfills, at the 2024 rate, by Ohio EPA's own figures: Stony Hollow (Montgomery) 4, Gallia County 7, Noble Road (Richland) 12, Apex (Jefferson) 13, Crawford County 14, Lake County 17, Lorain County II 18. Most space: Rumpke (Hamilton) 108.9 million cubic yards and 42 years, Tunnel Hill (Perry) 103.9 million and 44 years, American (Stark) 74.8 million and 93 years. A landfill with only a few years left can apply to expand, so none of these is a closing date.
Methane: Ohio reports the fourth-most
Buried trash rots and gives off methane, a gas that warms the climate. Forty-two Ohio landfills reported 168,592 tons of methane for 2023 to EPA's Greenhouse Gas Reporting Program. That is fourth among the states, after Texas (390,468 tons), California (276,549) and Florida (233,015), and 5.2 percent of the national total (EPA). Apex reported the most in Ohio, 27,967 tons, followed by Noble Road in Richland County (14,304), Beech Hollow in Jackson County (13,005), Rumpke in Hamilton County (11,326) and the Franklin County landfill (11,185).
These numbers are estimates from models, not readings from a meter at the fence. Federal rules have let a landfill choose which of two modelled figures to report, so the result depends on assumptions about how much gas its collection system captures. The records show this. The seven Ohio landfills that took more than a million tons in 2024 report methane that differs ninefold for each ton they took in.
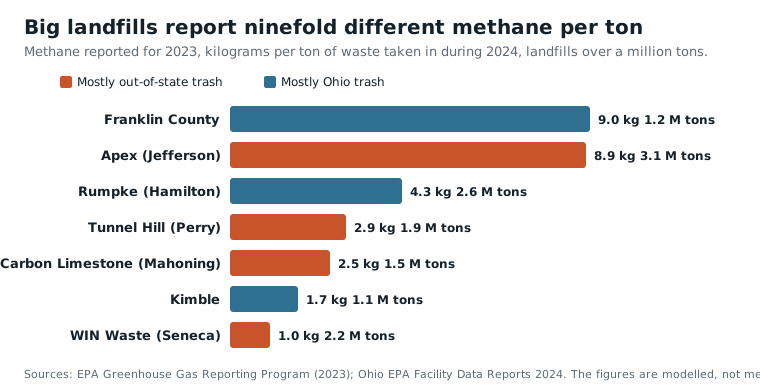
All four of the big importing landfills have gas collection systems on record (EPA LMOP). Apex has sold its gas into a pipeline since 2018 and Carbon Limestone since 2023, and projects at Sunny Farms and Tunnel Hill are listed as planned for 2026. Across Ohio, 16 landfill gas projects run at 13 landfills. Ten open landfills, all small ones, have no gas collection on record: Athens-Hocking, Beech Hollow, Coshocton, Crawford, Defiance, Gallia, Preble, Williams, Wilmington and Wood. Beech Hollow, with no collection, is Ohio's third-largest reporter.
Ohio's old dumps
3,041 old dumps, in every county
Before state solid waste rules and the federal landfill rules of 1976, nearly every town ran its own dump. Ohio EPA keeps two lists of them: 1,815 historic solid waste sites and 1,226 abandoned landfills. Together they mark 3,041 sites in all 88 counties (Ohio EPA). Of the 1,719 with a closing year, 789 (46 percent) closed by 1975. The 1970s alone account for 640 and the 1980s for 537. The earliest closed in 1940.
They sit in the floodplain nearly twice as often as the land does
Towns put their dumps on the cheapest low ground they had: a creek bottom, a ravine, a worked-out gravel pit. The records show it. Of the 3,041 old dumps, 365 (12.0 percent) lie inside FEMA's 1-percent-a-year flood zone, the area with a 1 in 100 chance of flooding in any year (FEMA). Only 6.4 percent of 6,000 random spots across Ohio do. Today's operating landfills, sited under modern rules, come in at 5.4 percent (2 of 37).
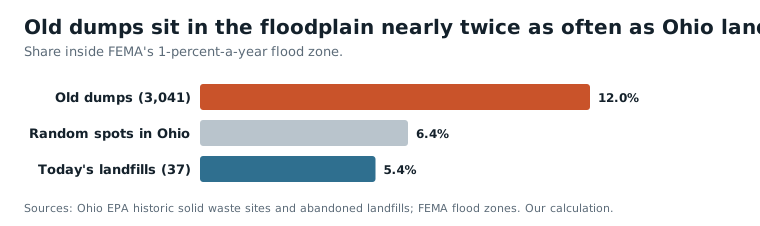
The two lists agree on their own (11.4 percent and 13.0 percent). A dump in a flood zone is not proof that waste reaches the river. It is a reason to look.
Rural counties have the most per person
Per 100,000 residents, the most old dumps are in Monroe County (239), Noble (210), Vinton (198), Paulding (155), Harrison (149) and Meigs (134). The fewest are in Clermont (3.2), Franklin (4.0), Warren (4.3), Delaware (8.3), Butler (9.2) and Hamilton (10.3). By area the order flips: Cuyahoga has 40 per 100 square miles, Summit 28, Montgomery 25.
The counts follow the number of communities more than the number of people. Counties with more named towns, villages and hamlets have more old dumps, a stronger link than with population or land area (USGS place names). Rural counties have many small communities for each resident, so they have many dumps for each resident. The suburban counties at the bottom were thinly settled when the dumps were made: Clermont and Franklin each had 7 old dumps per 100,000 people of their 1970 population, against 288 in Noble.
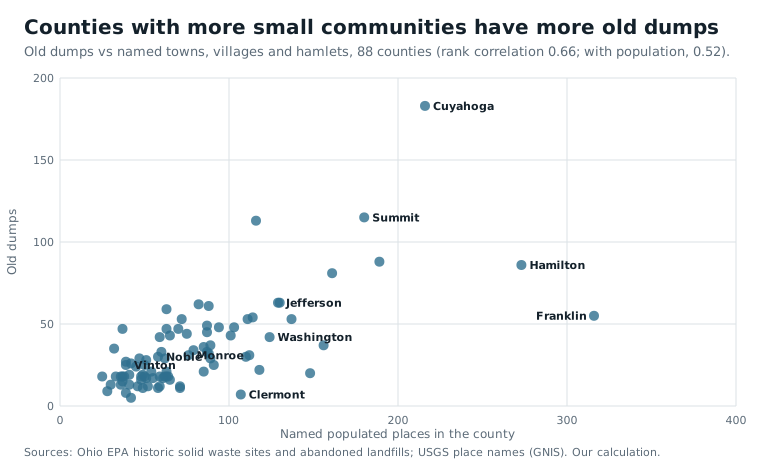
The counties that host today's import landfills have their share of old ones too: Jefferson 63, Perry 44 and Seneca 28.
Coal ash
Coal-burning power plants leave ash, and Ohio's plants buried it in ponds and landfills beside the plants. A national database kept by Earthjustice and the Environmental Integrity Project lists 33 Ohio units, 22 ponds and 11 landfills, at ten sites: nine power plants and one paper mill (Earthjustice; Environmental Integrity Project). Ohio has 33 of the 746 units in the national file.
All 22 ponds are unlined. Nineteen are rated high or significant hazard, a rating about the damage if the dam holding the pond failed, not about pollution. Every one of the ten sites lists at least one pollutant above federal health-based limits in its own monitoring wells, as of the 2018-2022 reports. Boron, a common sign of ash in groundwater, turns up at nine of the ten.
| Plant | County | Ponds (all unlined) | Ash landfills |
|---|---|---|---|
| J.M. Stuart | Adams | 5 | 3 |
| Killen | Adams | 3 | 0 |
| Zimmer | Clermont | 3 | 1 |
| Kyger Creek | Gallia | 2 | 1 |
| Gavin | Gallia | 2 | 1 |
| Miami Fort | Hamilton | 2 | 1 |
| Conesville | Coshocton | 1 | 1 |
| Cardinal | Jefferson | 2 | 1 |
| W.H. Sammis | Jefferson | 2 | 1 |
| Richmond Mill (paper mill) | Jefferson | 0 | 1 |
The largest single unit is Gavin's residual-waste landfill, 59.3 million cubic yards. The pollutant readings come from compliance wells at the edge of each unit. They are not drinking-water results and say nothing about anyone's well or tap. The plant statuses are as of November 2022, and some plants have changed hands since.
Brine and the wells that take it
Oil and gas wells bring up salty water, called brine or produced water, along with the oil and gas. Ohio gets rid of it by pumping it thousands of feet underground in disposal wells, which regulators call Class II injection wells. Ohio has run this program for the federal government since 1983.
ODNR's map listed 227 disposal wells as active in early 2026 (ODNR). In 2025, 167 of them took brine: 34,295,603 barrels, or 1.44 billion gallons (a barrel is 42 gallons). That is nearly four times the 8.87 million barrels of 2010. The peak was 47.0 million barrels in 2018. Sixty wells listed as active took nothing in 2025; "active" is a permit status, not a sign that a well is in use.
Ohio also has 11 wells that take hazardous industrial waste (Class I), the third-most in the country after Texas (73) and Louisiana (20) (EPA UIC inventory).
Four in ten barrels pay no fee
Ohio law charges the owner of a disposal well 5 cents a barrel for brine from the well's own ODNR district or the one next to it, and 20 cents for brine from anywhere else. But the law also says the most barrels a fee can be charged on, per well, per year, is 500,000 (R.C. 1509.22). The wording is the same in the 2013 and 2026 versions of the law.
In 2025, 23 wells passed that mark. Together they took 25.1 million of the state's 34.3 million barrels (73 percent). Everything they took above their 500,000th barrel, 13.56 million barrels or 39.6 percent of all the brine injected in Ohio, paid no fee.
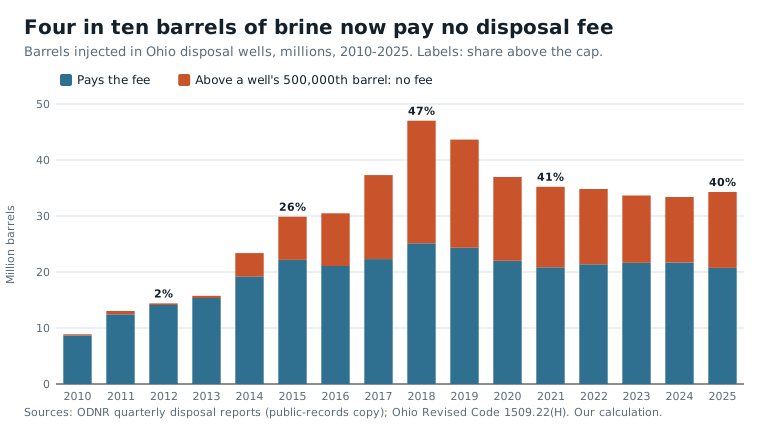
The cap was written for a smaller business. In 2012 the typical (median) well took 39,602 barrels, and only two wells in the state passed 500,000. The biggest commercial wells that opened after 2014 take one to two million barrels a year each, up to 3.7 million in their busiest years, and the number in the law never changed. The fee-free share was 1.9 percent in 2012, 25.8 percent in 2015, 46.6 percent in 2018 and 44.2 percent in 2019, and has stayed between 35 and 41 percent since 2020.
What the fee raised is not public, because only ODNR sees how much of each well's brine came from nearby. The law sets the limits. In 2025 the fee could have brought in as little as $1.04 million (if every barrel paid 5 cents) or as much as $4.15 million (if every barrel paid 20 cents). At the mix ODNR reported for 2024, about a third from out of state, it comes to about $2.09 million, roughly 6 cents a barrel. Without the cap it would be about $3.46 million.
By county in 2025:
| County | Barrels injected | Share above the cap (no fee) | Possible fee, low to high |
|---|---|---|---|
| Tuscarawas | 8.76 million | 63.7% | $159,000 to $636,000 |
| Washington | 7.16 million | 47.8% | $187,000 to $747,000 |
| Guernsey | 5.51 million | 43.9% | $155,000 to $618,000 |
| Trumbull | 1.63 million | 0% | $82,000 to $327,000 |
The money now goes to the general fund of the county where the well is. Under the 2013 version of the law it went to the state's oil and gas well fund. Fee-free barrels are legal; this is how the law is written.
Pennsylvania's brine stops at the first Ohio counties it reaches
Pennsylvania's shale wells reported 69.4 million barrels of produced fluid in 2025. (Ohio's shale wells reported 29.8 million barrels of brine in 2021, the latest year with a county table; the two states' reports do not measure the same thing.) Yet Pennsylvania has 19 brine disposal wells, against Ohio's 245 in EPA's count. West Virginia has 30. Pennsylvania never took over its own program, so EPA permits its wells directly.
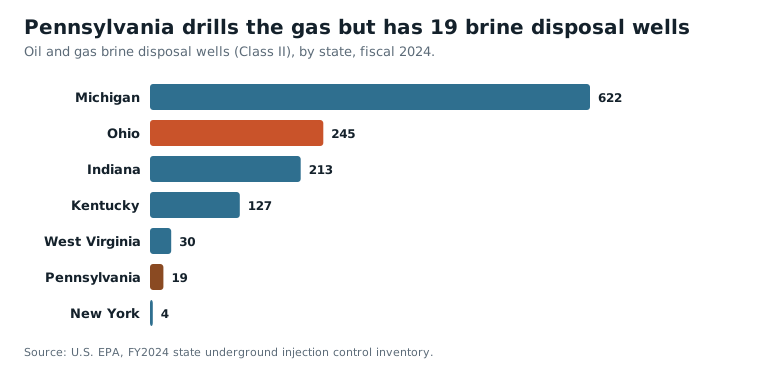
Most of Pennsylvania's fluid (Pennsylvania DEP) is reused at well pads or recycled, and only 4.14 million barrels (6.0 percent) went to disposal wells anywhere. Ohio took 3.18 million of those, 76.9 percent.
Brine moves by truck, so it goes to the nearest permitted well. In 2025, 95.5 percent of Pennsylvania's brine sent to Ohio went to four counties in the northeast corner, Trumbull, Mahoning, Portage and Ashtabula, three of them on the Pennsylvania line. In 2024 it was 95.3 percent. Pennsylvania's brine is 83 percent of everything injected in Trumbull County, 63 percent in Mahoning and 46 percent in Portage.
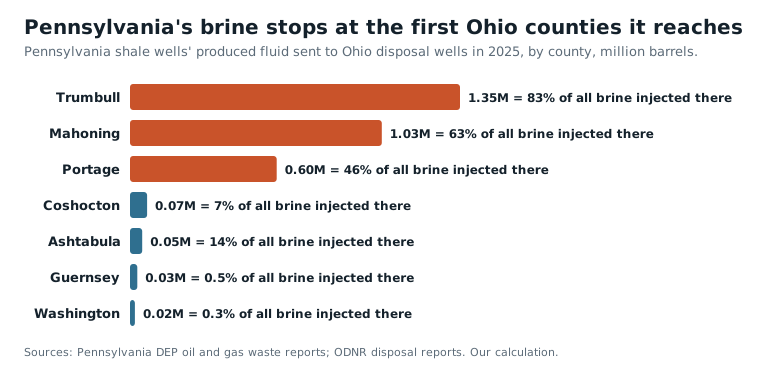
Ohio's three biggest brine counties, Washington, Tuscarawas and Guernsey, get almost none of Pennsylvania's: In 2025 Washington received 0.6 percent of it, Guernsey 0.8 percent and Tuscarawas almost none. Their brine is Ohio's own, plus some from West Virginia that no report measures.
ODNR told Farm and Dairy that 11,212,266 of the 32,936,244 barrels injected in 2024 (34.0 percent) came from out of state (Farm and Dairy). Pennsylvania's shale reports account for 4.40 million of those barrels. The other 6.8 million are not explained by any report we found, because Pennsylvania's older conventional wells and all of West Virginia's wells do not report where their brine goes.
The brine goes where the rock is, not where it is made
Nearly all of Ohio's shale brine comes from eight counties over the Utica shale: Belmont, Monroe, Jefferson, Harrison, Carroll, Guernsey, Noble and Columbiana. They produced 99.5 percent of it in 2021, but took only 24.2 percent of the state's injection (ODNR 2021 annual report). Belmont had 5 active disposal wells, Monroe 1, and Jefferson and Harrison none.
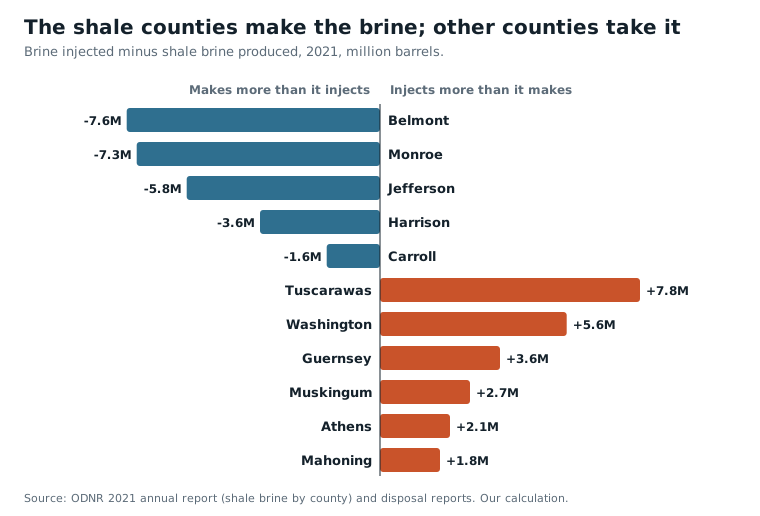
Tuscarawas County took 7.78 million barrels in 2021 and produced 4,937. The receiving counties have deep wells drilled into old sandstone and basement rock: a median of 8,348 feet in Tuscarawas and 8,910 in Guernsey. Over the shale itself almost no disposal wells have been permitted, so the brine rides west and south.
In 2025, 92 percent of Ohio's brine went into the 32 Appalachian counties, home to 16.6 percent of Ohioans. Per resident, Guernsey County took 144 barrels (about 6,000 gallons), Noble 129, Washington 123 and Tuscarawas 95. The receiving counties earn less than Ohio as a whole: a median household income of $65,083, weighted by barrels, against $74,831 for all Ohioans (Census SAIPE).
We tested whether the wells are steered to poorer places. Within Appalachian Ohio they are not. The 19 Appalachian counties with disposal wells have a median income of $62,931 and the 13 without them $60,099, a difference too small to mean anything (p = 0.65). The income gap is Appalachia's, not a choice of the poorest counties in it.
Disposal wells sit among the wells people drink from
ODNR's water-well logs record 654,990 wells drilled in Ohio. Of those, 9,334 lie within one mile of an active disposal well and 32,387 within two miles (ODNR water wells). The typical disposal well has 38 logged water wells within a mile, 27 of them for homes. The nearest is usually about 880 feet away, and 209 of the 227 disposal wells have one within half a mile. Since 2010, 1,335 new water wells have been drilled within a mile of one.
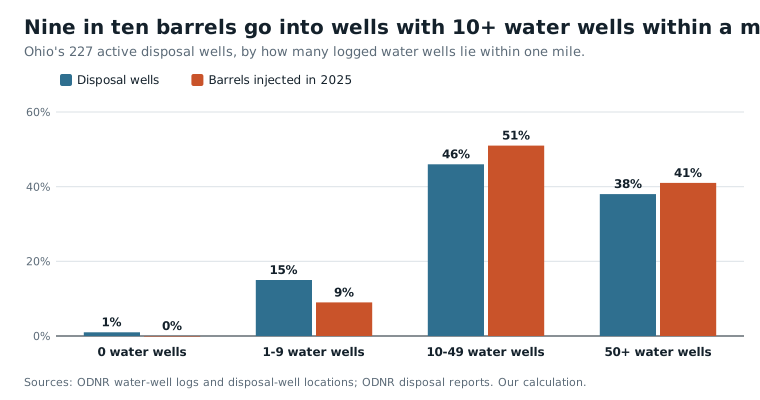
Public water systems are farther away, but not far. Four systems have a well within a mile of a disposal well, serving 97,682 people, almost all of them Aqua Ohio's Massillon system. Twenty-three systems serving 252,107 people have a well within two miles, among them Aqua Ohio's Struthers system, Marietta, Circleville, Coshocton and Logan. Eighty-nine systems serving 648,195 people have one within five miles.
The wells were not placed away from homes. The number of water wells within a mile of a disposal well is about the same as the county average (0.92 of it). The section of state law we read sets no minimum distance from household water wells; we did not check ODNR's permit rules.
Being close is not the same as being polluted. The wells that take nearly all the brine are drilled 3,500 to 9,000 feet down, far below the water people drink; a few dozen small, older wells are shallower, and together they took under 3 percent of 2025's barrels. ODNR concluded in July 2021 that water wells within half a mile of the Redbird #4 well in Washington County showed no brine (Farm and Dairy). Where brine has been documented moving in Ohio, it reached old oil and gas wells, not water wells, as the next section describes.
Washington County takes a fifth of Ohio's brine
Washington County took 7.16 million barrels in 2025, 20.9 percent of the state's brine, and 74.9 million barrels (3.15 billion gallons) from 2010 to 2025. It produces almost none: 39,320 barrels of shale brine in 2020, 0.6 percent of what it took in that year. The county's nine water authorities said 502 million gallons went into the county's wells in two years (Signal Ohio); the 2023-2024 reports add up to 513.7 million.
Washington's disposal wells are shallower than those of the other big brine counties, a median of 6,300 feet against 8,300 to 8,900 in Tuscarawas and Guernsey, in a county with a century of old, shallow oil wells. From November 2018 to December 2019, Redbird #4 injected 4.2 million barrels into the Ohio Shale at 3,676 to 4,070 feet. ODNR traced that brine into 28 oil and gas wells in the Berea sandstone, from one to more than five miles away (ODNR, 2020). In July 2026 four Washington County wells, Redbird No. 4 and No. 5, American Growers No. 1 and Nichols No. 1-A, stopped injecting voluntarily after ODNR found effects on nearby oil and gas wells (Farm and Dairy). No harm to a household water well has been documented.
Earthquakes: real, named and few
Injection can set off earthquakes by raising the pressure on a fault deep underground. Ohio has had clear cases.
- Youngstown, 2011. The Northstar 1 well began injecting in December 2010, 9,184 feet down into basement rock. ODNR counted 11 earthquakes near it between March 17 and December 31, 2011. ODNR had the well shut down on December 30, and a magnitude 4.0 struck the next day (ODNR, 2012). A 2013 study counted 109 small quakes and concluded they were caused by the injection (Kim, 2013).
- Ashtabula County, 1987 and 2001. A magnitude 3.5 quake on July 13, 1987 (3.8 in later work) and a 3.9 on January 26, 2001. Earlier studies, summarized by Kim (2013), tied them to waste injection at a deep industrial well.
- Trumbull County, 2014. ODNR suspended two disposal wells after quakes of magnitude 1.7 and 2.1. The owner sued the state for $20.5 million; in April 2026 the Ohio Supreme Court unanimously ruled against it (Signal Ohio).
What did not happen is a wave like Oklahoma's. In the U.S. Geological Survey's catalog, the area around Ohio had 0 to 3 earthquakes of magnitude 3 or more every year from 2005 to 2025, even as Ohio's brine injection more than tripled from 2012 to 2018. Oklahoma's area went from 1 in 2005 to 585 in 2014 and 888 in 2015, and 6 in 2025 (USGS).
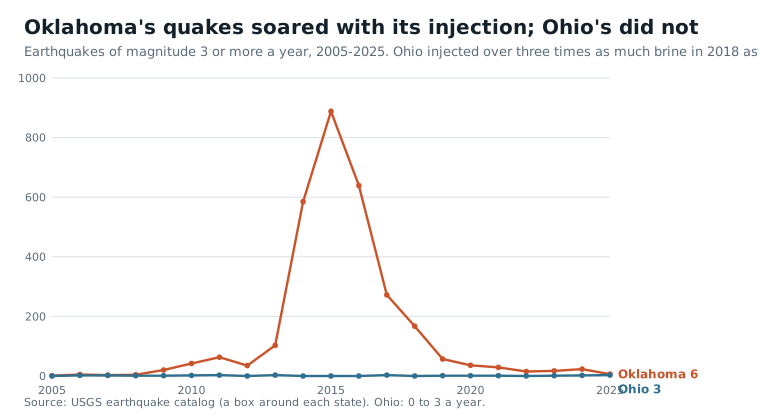
Volume explains the gap. Ohio's 34 million barrels a year equal about 17 hours of what the whole country injects, which EPA puts at more than 2 billion gallons a day (EPA).
How Ohio compares
Ohio's 8.15 million tons of imported trash in 2024 is about 85 percent of what Pennsylvania, the nation's biggest importer at the time, took in 2005, when Ohio took 3.0 million tons of all waste (1.69 million of household-type trash) from 27 states (Congressional Research Service). We found no newer national ranking from a federal source.
The United States as a whole buries half its municipal trash. Much of Europe buries almost none, because it recycles, composts or burns the rest.
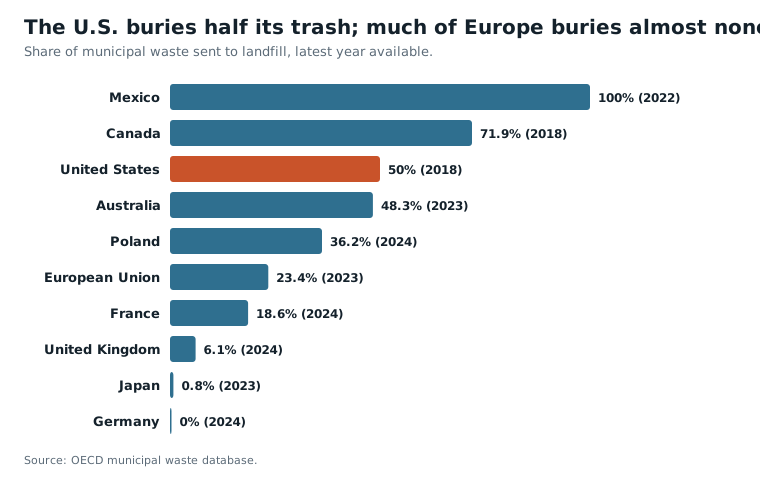
Landfills are the third-largest source of methane from human activity in the United States, 14.4 percent of it in 2022 (EPA). Ohio's landfills report 5.2 percent of the methane that U.S. landfills report to EPA.
What these records do not show
- Where each ton of trash came from after 2020. Ohio EPA's reports since then split waste only into in-district, out-of-district and out-of-state.
- A closing date for any landfill. Space is a permit and can be expanded.
- Measured methane. Every landfill figure is a model.
- What the brine fee actually raised. Only ODNR sees each well's mix of nearby and distant brine.
- Where 6.8 million barrels of out-of-state brine came from in 2024.
- Pollution from proximity. A dump in a floodplain or a disposal well near water wells is a reason to look, not a finding of harm. No household water well has been shown to be polluted by a disposal well in these records.
- Complete lists. Ohio EPA's old-dump lists miss sites handled under other programs, and its points should be checked against the agency's files.
Sources
- Ohio EPA, Facility Data Report 2024 (Internet Archive copy; the 2014-2023 reports were read the same way)
- Ohio EPA, solid waste fact sheet gd_1008
- Ohio EPA, historic solid waste sites and abandoned landfills
- U.S. EPA, Greenhouse Gas Reporting Program data sets
- U.S. EPA, Landfill Methane Outreach Program database
- U.S. EPA, basic information about landfill gas
- Earthjustice, coal ash contaminated sites
- Environmental Integrity Project, coal ash groundwater contamination
- FEMA, National Flood Hazard Layer
- USGS, Geographic Names Information System
- Ohio Revised Code 1509.22
- ODNR, Class II brine injection wells map, first quarter 2026
- FracTracker Alliance, Ohio Class II wells (public-records copy of ODNR's quarterly reports)
- ODNR, 2021 oil and gas annual report
- ODNR, Washington County produced water investigation, 2020
- ODNR, preliminary report on Northstar 1 and the Youngstown earthquakes, 2012
- ODNR, Ohio water wells
- Pennsylvania DEP, oil and gas well waste reports
- U.S. EPA, FY2024 state underground injection control inventory
- U.S. EPA, Class II oil and gas related injection wells
- Kim, W.-Y. (2013), Induced seismicity associated with fluid injection into a deep well in Youngstown, Ohio, Journal of Geophysical Research
- USGS earthquake catalog
- U.S. Census Bureau, Small Area Income and Poverty Estimates
- Congressional Research Service, Interstate Shipment of Municipal Solid Waste (RL34043)
- OECD Data Explorer, municipal waste database
- Philadelphia v. New Jersey, 437 U.S. 617 (1978)
- Oregon Waste Systems v. Department of Environmental Quality, 511 U.S. 93 (1994)
- Farm and Dairy, Marietta residents find brine waste in gas wells
- Farm and Dairy, four injection wells in Washington County shut down
- Signal Ohio, four underground waste wells suspended
- Signal Ohio, no payout for fracking waste company that caused earthquakes
Towns and ZIP codes
Water, health, jobs and history for the places on the shores and just downstream.
Towns
ZIP codes
Questions
How much of the trash in Ohio's landfills comes from other states?
In 2024 Ohio's landfills took 22.1 million tons of waste, and 8.15 million tons of it (36.8 percent) came from other states, according to Ohio EPA's Facility Data Report. Ten years earlier the share was 13.8 percent. Counting only the public landfills that take household and business trash, the share rose from 19.7 percent in 2014 to 37.5 percent in 2024. Four landfills took 94 percent of the imported tons: Apex in Jefferson County, WIN Waste (the former Sunny Farms) in Seneca County, Tunnel Hill in Perry County and Carbon Limestone in Mahoning County.
Why can't Ohio refuse other states' trash?
The U.S. Supreme Court has ruled that trash is commerce between the states. In Philadelphia v. New Jersey (1978) it struck down a state ban on out-of-state waste, and in Oregon Waste Systems v. Oregon (1994) it struck down a higher fee on it. So Ohio cannot close its landfills to other states' trash or charge it more than Ohio's own.
How many old dumps are there in Ohio?
Ohio EPA's two lists, 1,815 historic solid waste sites and 1,226 abandoned landfills, add up to 3,041 old dumps in all 88 counties. Of the 1,719 with a closing year, 46 percent closed by 1975. Most of those with a closing year closed in the 1960s, 1970s and 1980s, as state solid waste rules and the federal landfill rules of 1976 shut the town dumps. Ohio EPA says the locations should be checked against its original files.
What is a brine disposal well?
Oil and gas wells bring up salty water called brine along with the oil and gas. A disposal well, which regulators call a Class II injection well, pumps that brine thousands of feet underground, far below the rock that holds drinking water. Ohio had 227 disposal wells listed as active in early 2026, and they took 34.3 million barrels (1.44 billion gallons) in 2025.
Do injection well owners pay a fee in Ohio?
Yes, but only on part of the brine. Ohio law (R.C. 1509.22) charges 5 cents a barrel for brine from nearby and 20 cents for brine from farther away, but stops charging once a well has taken 500,000 barrels in a year. In 2025, 23 wells passed that mark, and 13.6 million barrels, 39.6 percent of everything injected in Ohio, paid no fee.
Do injection wells cause earthquakes in Ohio?
Some have. Ohio's best-known case is Youngstown in 2011, where earthquakes up to magnitude 4.0 began near the Northstar 1 disposal well and a 2013 scientific study concluded they were caused by the injection. Earthquakes in Ashtabula County in 1987 and 2001 have also been tied to a deep waste well. But Ohio's count of earthquakes of magnitude 3 or more stayed at 0 to 3 a year from 2005 to 2025, even as the brine injected more than tripled from 2012 to 2018.
Are injection wells near drinking water wells?
Often. 9,334 of the water wells in ODNR's well logs lie within a mile of one of Ohio's 227 active disposal wells, and the median disposal well has 38 within a mile. Twenty-three public water systems serving 252,107 people have a well within two miles of one. Being close is not the same as being polluted: the brine mostly goes in 3,500 to 9,000 feet down, and ODNR said in 2021 that water wells within half a mile of one Washington County well showed no brine.
More deep dives
- Brian PoindexterCuyahoga, Medina, Wayne, Ashland · topic
- Columbus Day in OhioFranklin, Muskingum, Cuyahoga, Summit, Hamilton, Lorain, Mahoning, Putnam, Wood · topic
- Crew Stadium Site and the Hollywood Casino VoteFranklin · topic
- Election Day and the MidtermsHamilton, Cuyahoga, Marion, Lake, Stark, Carroll, Knox, Franklin, Fulton, Shelby, Montgomery · topic
- Flock Cameras in OhioCuyahoga, Franklin, Hamilton, Summit, Montgomery, Lucas, Butler, Lorain, Warren, Stark, Clark, Greene · topic
- Ohio data centersFranklin, Licking, Cuyahoga, Hamilton, Summit, Butler, Montgomery, Delaware · topic