An insight across Ohio's 88 counties
Health-based drinking water violations and the presidential vote
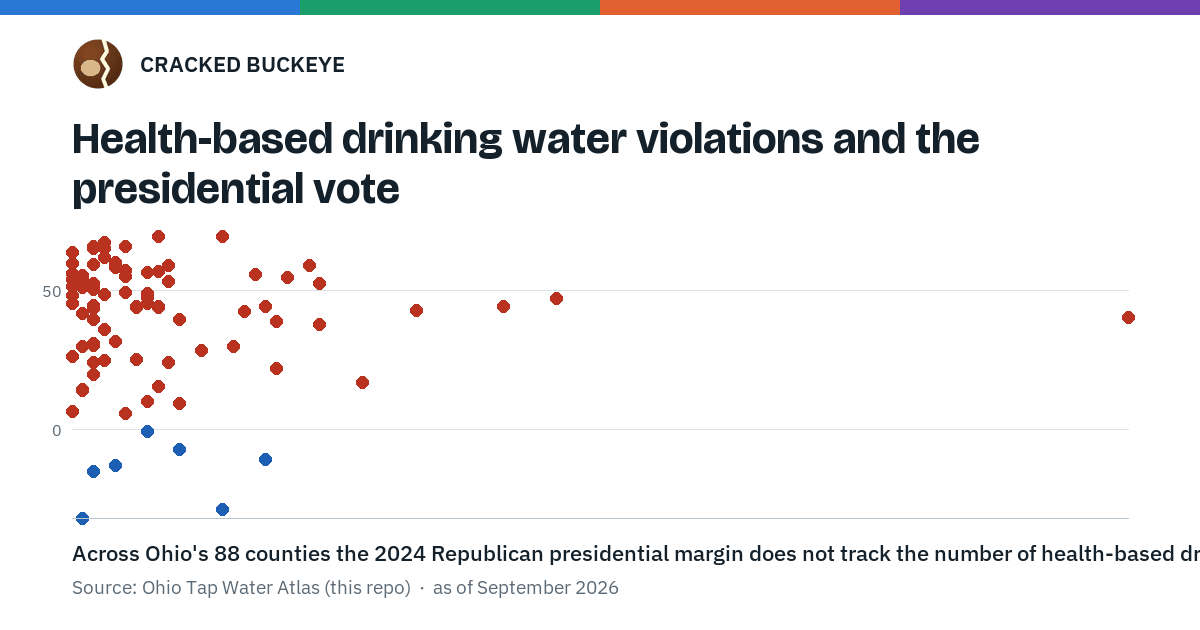
Across Ohio's 88 counties the 2024 Republican presidential margin does not track the number of health-based drinking water violations the atlas recorded over the past fifteen years (Spearman rho -0.12; partial rho -0.15 with log population held fixed; -0.14 without Cuyahoga and Franklin; n = 88).
Where the counties sit
One dot per county: Health-based drinking water violations (trailing ~15yr) in 2026 across the bottom, the 2024 presidential margin in points up the side. Every dot links to that county's own result for that election.
The numbers behind this figure, as a table
| County | Health-based drinking water violations (trailing ~15yr), 2026 | Presidential margin, 2024 (R minus D, points) |
|---|---|---|
| adams | 2 | R+66.1 |
| allen | 8 | R+44.5 |
| ashland | 2 | R+50.4 |
| ashtabula | 12 | R+28.6 |
| athens | 18 | D+10.8 |
| auglaize | 2 | R+65.1 |
| belmont | 7 | R+47.6 |
| brown | 3 | R+61.8 |
| butler | 0 | R+26.5 |
| carroll | 5 | R+55.2 |
| champaign | 1 | R+51.2 |
| clark | 15 | R+29.8 |
| clermont | 3 | R+36.1 |
| clinton | 1 | R+55.1 |
| columbiana | 5 | R+49.4 |
| coshocton | 2 | R+52.6 |
| crawford | 9 | R+53.4 |
| Cuyahoga | 1 | D+31.7 |
| darke | 5 | R+65.8 |
| defiance | 98 | R+40.2 |
| delaware | 0 | R+6.7 |
| erie | 1 | R+14.3 |
| fairfield | 2 | R+24.3 |
| fayette | 1 | R+55.6 |
| Franklin | 14 | D+28.7 |
| fulton | 32 | R+42.8 |
| gallia | 0 | R+59.8 |
| geauga | 9 | R+24.3 |
| greene | 2 | R+20.0 |
| guernsey | 23 | R+52.4 |
| hamilton | 2 | D+15.0 |
| hancock | 19 | R+38.9 |
| hardin | 5 | R+55.2 |
| harrison | 17 | R+55.7 |
| henry | 45 | R+47.1 |
| highland | 0 | R+63.7 |
| hocking | 2 | R+44.6 |
| holmes | 8 | R+69.7 |
| huron | 6 | R+44.4 |
| jackson | 4 | R+58.4 |
| jefferson | 18 | R+44.4 |
| knox | 0 | R+45.3 |
| lake | 1 | R+14.5 |
| lawrence | 2 | R+50.9 |
| licking | 2 | R+30.3 |
| logan | 7 | R+56.7 |
| lorain | 5 | R+5.8 |
| lucas | 4 | D+12.7 |
| madison | 8 | R+44.1 |
| mahoning | 10 | R+9.5 |
| marion | 1 | R+41.7 |
| medina | 3 | R+25.0 |
| meigs | 5 | R+57.4 |
| mercer | 3 | R+67.2 |
| miami | 7 | R+45.5 |
| monroe | 4 | R+60.3 |
| montgomery | 7 | D+0.5 |
| morgan | 1 | R+53.6 |
| morrow | 0 | R+56.2 |
| muskingum | 40 | R+44.3 |
| noble | 3 | R+65.1 |
| ottawa | 6 | R+25.3 |
| paulding | 8 | R+56.8 |
| perry | 20 | R+54.9 |
| pickaway | 7 | R+49.0 |
| pike | 0 | R+54.0 |
| portage | 8 | R+15.7 |
| preble | 2 | R+59.6 |
| putnam | 14 | R+69.4 |
| richland | 16 | R+42.7 |
| ross | 2 | R+39.7 |
| sandusky | 2 | R+31.1 |
| scioto | 0 | R+48.2 |
| seneca | 23 | R+37.9 |
| shelby | 2 | R+65.3 |
| stark | 19 | R+22.1 |
| summit | 10 | D+7.0 |
| trumbull | 27 | R+16.9 |
| tuscarawas | 2 | R+43.6 |
| union | 1 | R+29.9 |
| van-wert | 9 | R+59.0 |
| vinton | 22 | R+59.0 |
| warren | 4 | R+31.8 |
| washington | 6 | R+44.1 |
| wayne | 10 | R+39.6 |
| williams | 3 | R+48.7 |
| wood | 7 | R+10.3 |
| wyandot | 0 | R+51.6 |
| Figure | Value | What it is |
|---|---|---|
| Counties measured | 88 | the measure in 2026 against the presidential vote in 2024 |
| Spearman rho | -0.12 | the rank correlation across all counties measured |
| Partial Spearman rho | -0.15 | the same rank correlation with log population held fixed |
| Pearson r | -0.03 | the linear correlation, for comparison with the rank figure above |
| Spearman rho without Cuyahoga and Franklin | -0.14 | n = 86 |
Across all 88 counties the rank correlation is -0.12. With Cuyahoga and Franklin set aside, 86 counties, it is -0.14.
The measure, county by county
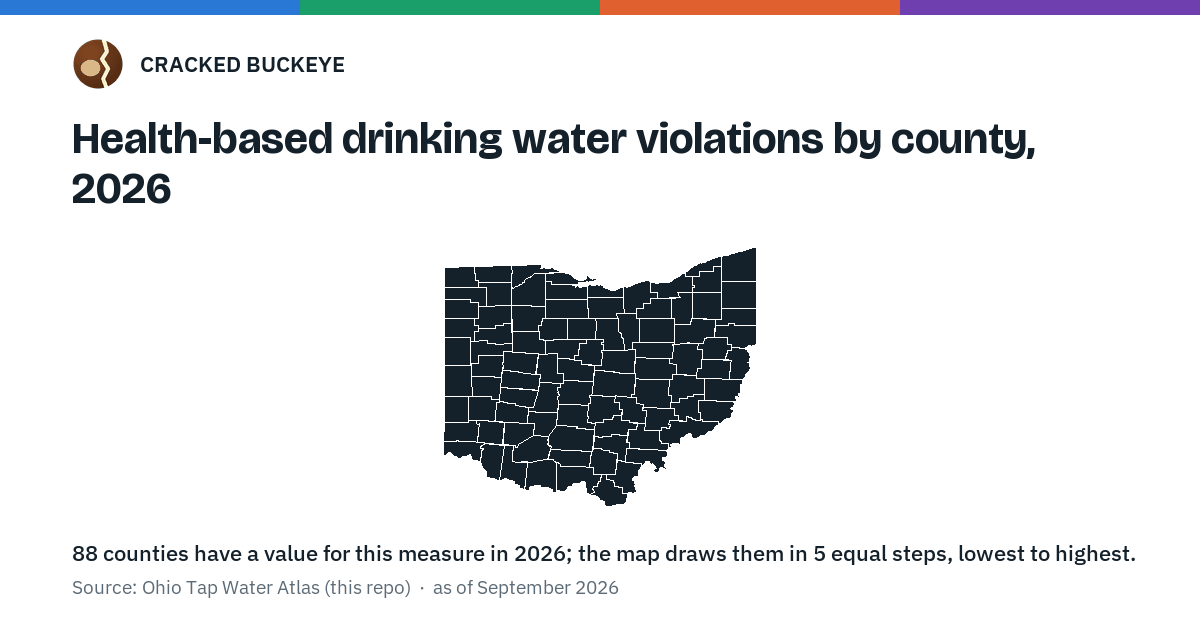
Health-based drinking water violations (trailing ~15yr) in 2026, in five steps of one ink from the lowest counties to the highest. No party color: this map draws a measure, not a vote.
The numbers behind this figure, as a table
| County | Health-based drinking water violations (trailing ~15yr) |
|---|---|
| Adams | 2 |
| Allen | 8 |
| Ashland | 2 |
| Ashtabula | 12 |
| Athens | 18 |
| Auglaize | 2 |
| Belmont | 7 |
| Brown | 3 |
| Butler | 0 |
| Carroll | 5 |
| Champaign | 1 |
| Clark | 15 |
| Clermont | 3 |
| Clinton | 1 |
| Columbiana | 5 |
| Coshocton | 2 |
| Crawford | 9 |
| Cuyahoga | 1 |
| Darke | 5 |
| Defiance | 98 |
| Delaware | 0 |
| Erie | 1 |
| Fairfield | 2 |
| Fayette | 1 |
| Franklin | 14 |
| Fulton | 32 |
| Gallia | 0 |
| Geauga | 9 |
| Greene | 2 |
| Guernsey | 23 |
| Hamilton | 2 |
| Hancock | 19 |
| Hardin | 5 |
| Harrison | 17 |
| Henry | 45 |
| Highland | 0 |
| Hocking | 2 |
| Holmes | 8 |
| Huron | 6 |
| Jackson | 4 |
| Jefferson | 18 |
| Knox | 0 |
| Lake | 1 |
| Lawrence | 2 |
| Licking | 2 |
| Logan | 7 |
| Lorain | 5 |
| Lucas | 4 |
| Madison | 8 |
| Mahoning | 10 |
| Marion | 1 |
| Medina | 3 |
| Meigs | 5 |
| Mercer | 3 |
| Miami | 7 |
| Monroe | 4 |
| Montgomery | 7 |
| Morgan | 1 |
| Morrow | 0 |
| Muskingum | 40 |
| Noble | 3 |
| Ottawa | 6 |
| Paulding | 8 |
| Perry | 20 |
| Pickaway | 7 |
| Pike | 0 |
| Portage | 8 |
| Preble | 2 |
| Putnam | 14 |
| Richland | 16 |
| Ross | 2 |
| Sandusky | 2 |
| Scioto | 0 |
| Seneca | 23 |
| Shelby | 2 |
| Stark | 19 |
| Summit | 10 |
| Trumbull | 27 |
| Tuscarawas | 2 |
| Union | 1 |
| Van Wert | 9 |
| Vinton | 22 |
| Warren | 4 |
| Washington | 6 |
| Wayne | 10 |
| Williams | 3 |
| Wood | 7 |
| Wyandot | 0 |
The counties at each end
The five counties highest on the measure and the five lowest, with what each one voted in 2024.
| County | End | Health-based drinking water violations (trailing ~15yr) | Presidential margin, 2024 |
|---|---|---|---|
| Defiance County | Highest on this measure | 98 | R+40.2 |
| Henry County | Highest on this measure | 45 | R+47.1 |
| Muskingum County | Highest on this measure | 40 | R+44.3 |
| Fulton County | Highest on this measure | 32 | R+42.8 |
| Trumbull County | Highest on this measure | 27 | R+16.9 |
| Wyandot County | Lowest on this measure | 0 | R+51.6 |
| Scioto County | Lowest on this measure | 0 | R+48.2 |
| Pike County | Lowest on this measure | 0 | R+54.0 |
| Morrow County | Lowest on this measure | 0 | R+56.2 |
| Knox County | Lowest on this measure | 0 | R+45.3 |
What this does not say
This is a pattern across counties, not a fact about any voter.
County measures mostly rise with county size, so the partial figure holds log population fixed; the figure without Cuyahoga and Franklin shows whether the two largest counties carry the pattern on their own.
A fifteen-year running count with no time dimension of its own: the atlas holds one snapshot, so this figure is a cross-section and can say no more than that.
Sources
The measure's own source and the election results this site holds, which every figure above is drawn from.
- county rollups of water system counts/violations · Ohio Tap Water Atlas (this repo) · accessed 2026-09
- Presidential results by county, and Ohio's statewide results: Ohio in presidential elections, where every year names its own source.
Cite and data
Cite this page as:
Cracked Buckeye (Open Shower Co), "Health-based drinking water violations and the presidential vote", https://crackedbuckeye.com/insights/health-based-water-violations/, built 2026-09-22, accessed [date].
Machine-readable: /api/politics/insights/health-based-water-violations.json (open JSON, CC BY 4.0 for the compilation; the underlying records keep their own terms) · How to cite · Report a correction · Built 2026-09-22
This page has a JSON twin: /api/politics/insights/health-based-water-violations.json — the record itself, with every statistic on this page and the figure specs behind the pictures.