An insight across Ohio's 88 counties
Population change 1950 to 1990 and the presidential vote
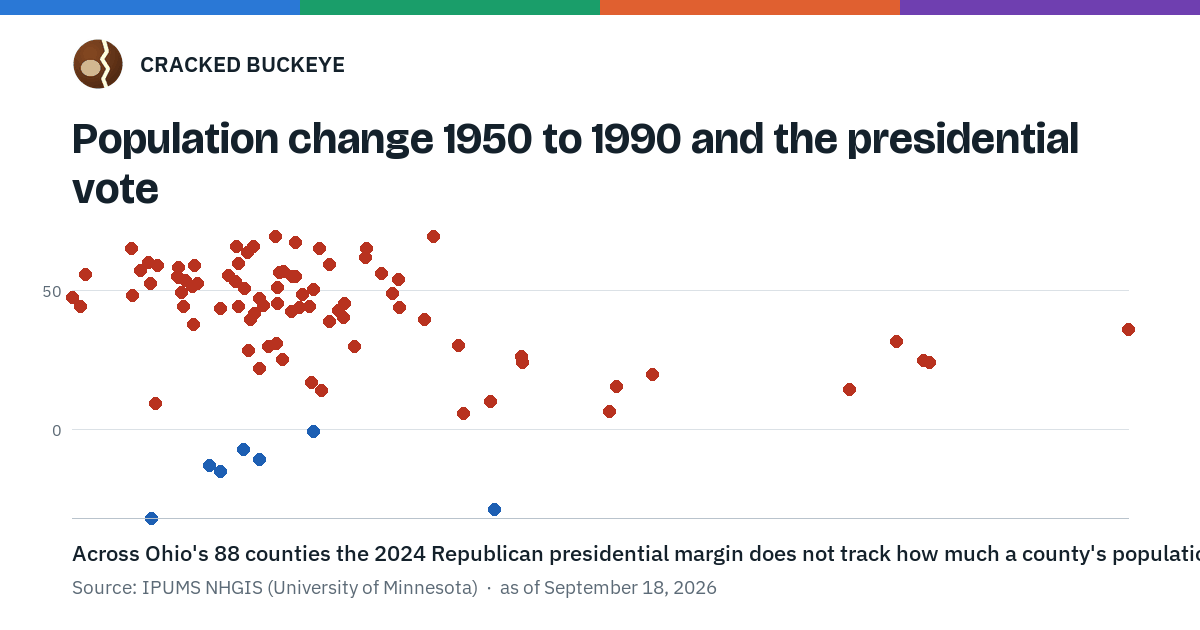
Across Ohio's 88 counties the 2024 Republican presidential margin does not track how much a county's population changed between 1950 and 1990 (Spearman rho -0.32; partial rho -0.06 with log population held fixed; -0.34 without Cuyahoga and Franklin; n = 88).
Where the counties sit
One dot per county: Population change, 1950 to 1990 (percent) in 1990 across the bottom, the 2024 presidential margin in points up the side. Every dot links to that county's own result for that election.
The numbers behind this figure, as a table
| County | Population change, 1950 to 1990 (percent), 1990 | Presidential margin, 2024 (R minus D, points) |
|---|---|---|
| adams | 23.8% | R+66.1 |
| allen | 24.5% | R+44.5 |
| ashland | 43.8% | R+50.4 |
| ashtabula | 26.8% | R+28.6 |
| athens | 29.9% | D+10.8 |
| auglaize | 45.5% | R+65.1 |
| belmont | -19.0% | R+47.6 |
| brown | 57.4% | R+61.8 |
| butler | 98.0% | R+26.5 |
| carroll | 39.3% | R+55.2 |
| champaign | 34.4% | R+51.2 |
| clark | 32.1% | R+29.8 |
| clermont | 256.0% | R+36.1 |
| clinton | 38.5% | R+55.1 |
| columbiana | 9.5% | R+49.4 |
| coshocton | 13.8% | R+52.6 |
| crawford | 23.6% | R+53.4 |
| Cuyahoga | 1.6% | D+31.7 |
| darke | 28.3% | R+65.8 |
| defiance | 51.8% | R+40.2 |
| delaware | 121.0% | R+6.7 |
| erie | 46.1% | R+14.3 |
| fairfield | 98.5% | R+24.3 |
| fayette | 21.8% | R+55.6 |
| Franklin | 91.0% | D+28.7 |
| fulton | 50.5% | R+42.8 |
| gallia | 24.3% | R+59.8 |
| geauga | 204.5% | R+24.3 |
| greene | 132.2% | R+20.0 |
| guernsey | 1.5% | R+52.4 |
| hamilton | 19.7% | D+15.0 |
| hancock | 48.0% | R+38.9 |
| hardin | 8.5% | R+55.2 |
| harrison | -15.6% | R+55.7 |
| henry | 29.8% | R+47.1 |
| highland | 26.7% | R+63.7 |
| hocking | 30.8% | R+44.6 |
| holmes | 75.1% | R+69.7 |
| huron | 42.9% | R+44.4 |
| jackson | 8.9% | R+58.4 |
| jefferson | -16.8% | R+44.4 |
| knox | 34.5% | R+45.3 |
| lake | 183.6% | R+14.5 |
| lawrence | 25.9% | R+50.9 |
| licking | 81.6% | R+30.3 |
| logan | 35.1% | R+56.7 |
| lorain | 83.0% | R+5.8 |
| lucas | 16.9% | D+12.7 |
| madison | 66.2% | R+44.1 |
| mahoning | 2.8% | R+9.5 |
| marion | 28.7% | R+41.7 |
| medina | 202.7% | R+25.0 |
| meigs | -1.0% | R+57.4 |
| mercer | 39.3% | R+67.2 |
| miami | 52.0% | R+45.5 |
| monroe | 0.9% | R+60.3 |
| montgomery | 44.0% | D+0.5 |
| morgan | 10.6% | R+53.6 |
| morrow | 61.6% | R+56.2 |
| muskingum | 10.1% | R+44.3 |
| noble | -3.5% | R+65.1 |
| ottawa | 35.8% | R+25.3 |
| paulding | 36.2% | R+56.8 |
| perry | 8.8% | R+54.9 |
| pickaway | 64.4% | R+49.0 |
| pike | 66.0% | R+54.0 |
| portage | 122.9% | R+15.7 |
| preble | 48.1% | R+59.6 |
| putnam | 33.9% | R+69.4 |
| richland | 38.1% | R+42.7 |
| ross | 27.4% | R+39.7 |
| sandusky | 34.4% | R+31.1 |
| scioto | -3.1% | R+48.2 |
| seneca | 12.8% | R+37.9 |
| shelby | 57.7% | R+65.3 |
| stark | 29.8% | R+22.1 |
| summit | 25.6% | D+7.0 |
| trumbull | 43.4% | R+16.9 |
| tuscarawas | 19.6% | R+43.6 |
| union | 54.5% | R+29.9 |
| van-wert | 13.0% | R+59.0 |
| vinton | 3.2% | R+59.0 |
| warren | 195.8% | R+31.8 |
| washington | 40.2% | R+44.1 |
| wayne | 72.8% | R+39.6 |
| williams | 41.0% | R+48.7 |
| wood | 90.0% | R+10.3 |
| wyandot | 12.5% | R+51.6 |
| Figure | Value | What it is |
|---|---|---|
| Counties measured | 88 | the measure in 1990 against the presidential vote in 2024 |
| Spearman rho | -0.32 | the rank correlation across all counties measured |
| Partial Spearman rho | -0.06 | the same rank correlation with log population held fixed |
| Pearson r | -0.27 | the linear correlation, for comparison with the rank figure above |
| Spearman rho without Cuyahoga and Franklin | -0.34 | n = 86 |
Across all 88 counties the rank correlation is -0.32. With Cuyahoga and Franklin set aside, 86 counties, it is -0.34.
The measure, county by county
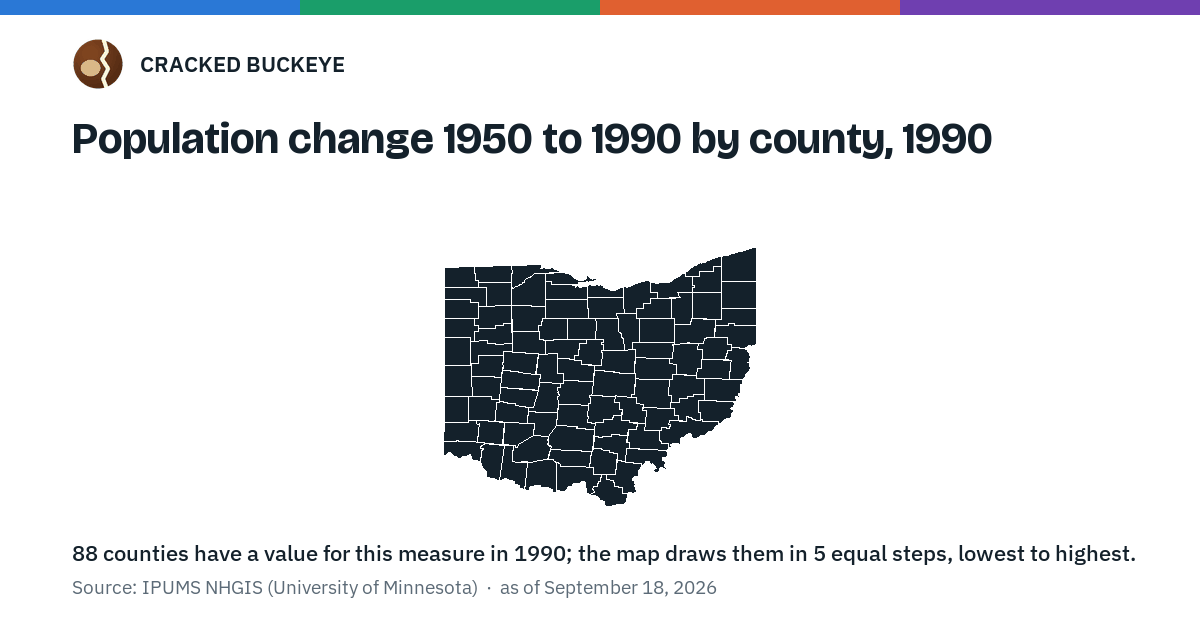
Population change, 1950 to 1990 (percent) in 1990, in five steps of one ink from the lowest counties to the highest. No party color: this map draws a measure, not a vote.
The numbers behind this figure, as a table
| County | Population change, 1950 to 1990 (percent) |
|---|---|
| Adams | 23.8% |
| Allen | 24.5% |
| Ashland | 43.8% |
| Ashtabula | 26.8% |
| Athens | 29.9% |
| Auglaize | 45.5% |
| Belmont | -19.0% |
| Brown | 57.4% |
| Butler | 98.0% |
| Carroll | 39.3% |
| Champaign | 34.4% |
| Clark | 32.1% |
| Clermont | 256.0% |
| Clinton | 38.5% |
| Columbiana | 9.5% |
| Coshocton | 13.8% |
| Crawford | 23.6% |
| Cuyahoga | 1.6% |
| Darke | 28.3% |
| Defiance | 51.8% |
| Delaware | 121.0% |
| Erie | 46.1% |
| Fairfield | 98.5% |
| Fayette | 21.8% |
| Franklin | 91.0% |
| Fulton | 50.5% |
| Gallia | 24.3% |
| Geauga | 204.5% |
| Greene | 132.2% |
| Guernsey | 1.5% |
| Hamilton | 19.7% |
| Hancock | 48.0% |
| Hardin | 8.5% |
| Harrison | -15.6% |
| Henry | 29.8% |
| Highland | 26.7% |
| Hocking | 30.8% |
| Holmes | 75.1% |
| Huron | 42.9% |
| Jackson | 8.9% |
| Jefferson | -16.8% |
| Knox | 34.5% |
| Lake | 183.6% |
| Lawrence | 25.9% |
| Licking | 81.6% |
| Logan | 35.1% |
| Lorain | 83.0% |
| Lucas | 16.9% |
| Madison | 66.2% |
| Mahoning | 2.8% |
| Marion | 28.7% |
| Medina | 202.7% |
| Meigs | -1.0% |
| Mercer | 39.3% |
| Miami | 52.0% |
| Monroe | 0.9% |
| Montgomery | 44.0% |
| Morgan | 10.6% |
| Morrow | 61.6% |
| Muskingum | 10.1% |
| Noble | -3.5% |
| Ottawa | 35.8% |
| Paulding | 36.2% |
| Perry | 8.8% |
| Pickaway | 64.4% |
| Pike | 66.0% |
| Portage | 122.9% |
| Preble | 48.1% |
| Putnam | 33.9% |
| Richland | 38.1% |
| Ross | 27.4% |
| Sandusky | 34.4% |
| Scioto | -3.1% |
| Seneca | 12.8% |
| Shelby | 57.7% |
| Stark | 29.8% |
| Summit | 25.6% |
| Trumbull | 43.4% |
| Tuscarawas | 19.6% |
| Union | 54.5% |
| Van Wert | 13.0% |
| Vinton | 3.2% |
| Warren | 195.8% |
| Washington | 40.2% |
| Wayne | 72.8% |
| Williams | 41.0% |
| Wood | 90.0% |
| Wyandot | 12.5% |
The counties at each end
The five counties highest on the measure and the five lowest, with what each one voted in 2024.
| County | End | Population change, 1950 to 1990 (percent) | Presidential margin, 2024 |
|---|---|---|---|
| Clermont County | Highest on this measure | 256.0% | R+36.1 |
| Geauga County | Highest on this measure | 204.5% | R+24.3 |
| Medina County | Highest on this measure | 202.7% | R+25.0 |
| Warren County | Highest on this measure | 195.8% | R+31.8 |
| Lake County | Highest on this measure | 183.6% | R+14.5 |
| Belmont County | Lowest on this measure | -19.0% | R+47.6 |
| Jefferson County | Lowest on this measure | -16.8% | R+44.4 |
| Harrison County | Lowest on this measure | -15.6% | R+55.7 |
| Noble County | Lowest on this measure | -3.5% | R+65.1 |
| Scioto County | Lowest on this measure | -3.1% | R+48.2 |
What this does not say
This is a pattern across counties, not a fact about any voter.
County measures mostly rise with county size, so the partial figure holds log population fixed; the figure without Cuyahoga and Franklin shows whether the two largest counties carry the pattern on their own.
The two county populations come from the historical census tables the panel was backfilled with, and the table pulled differs from decade to decade. Built here from the decennial county populations of 1950 and 1990, so it is a measure of the forty years before the elections drawn beside it, not of today.
Sources
The measure's own source and the election results this site holds, which every figure above is drawn from.
- Decennial census county tables, 1940-2000 (population, race, education, labor force, income, housing tenure/value/rent, urban/rural) · IPUMS NHGIS (University of Minnesota) · accessed 2026-09-18
- Presidential results by county, and Ohio's statewide results: Ohio in presidential elections, where every year names its own source.
Cite and data
Cite this page as:
Cracked Buckeye (Open Shower Co), "Population change 1950 to 1990 and the presidential vote", https://crackedbuckeye.com/insights/population-change-1950-1990/, built 2026-09-22, accessed [date].
Machine-readable: /api/politics/insights/population-change-1950-1990.json (open JSON, CC BY 4.0 for the compilation; the underlying records keep their own terms) · How to cite · Report a correction · Built 2026-09-22
This page has a JSON twin: /api/politics/insights/population-change-1950-1990.json — the record itself, with every statistic on this page and the figure specs behind the pictures.