ZIP code 45506: Springfield
Clark County · 13,330 residents
Groundwater from 12 wells along Eagle City Road in the Mad River buried-valley aquifer, pumped to the adjacent treatment plant. Springfield City Water Treatment Plant · Springfield City. The water here
45506 in 10 facts
The 10 things that stand out about this ZIP against the other 1,232 in Ohio, each with its source.
- Where the water comes from Where the water here comes from: Groundwater from 12 wells along Eagle City Road in the Mad River buried-valley aquifer, pumped to the adjacent treatment plant. Source: EPA SDWIS
- Historic places 5 This ZIP has a lot of listed historic places: 5 on the National Register, more than 86% of Ohio ZIPs. Source: National Register data
- Crime 13.8 per 1,000 residents Violent crime runs high here: 13.8 offenses per 1,000 residents in 2024, more than 97% of Ohio ZIPs with a reporting agency. Source: FBI Crime Data Explorer
- Life expectancy 71.2 years Life expectancy runs low here: 71.2 years at birth, lower than 97% of Ohio ZIPs. Source: CDC USALEEP
- Health 30.9% Self-reported health runs worse here: 30.9% of adults report fair or poor health, more than 96% of Ohio ZIPs. Source: CDC PLACES
- Hazard risk 15 Natural hazard risk runs low here: a FEMA National Risk Index score of 15, lower than 92% of Ohio ZIPs. Source: FEMA National Risk Index
- Sewage plants 12 quarters The nearest sewage plant has a rough record: in violation 12 of the last 12 quarters, more than 78% of Ohio ZIPs' nearest plants. Source: EPA ECHO
- School ratings 2.5 stars The main school district here rates low: 2.5 stars on the Ohio Report Card, lower than 83% of Ohio ZIPs. Source: Ohio school report cards
- Homes and income $107,300 Home values run low here: a median of $107,300, lower than 88% of Ohio ZIPs. Source: Census ACS
- Rail crossings 12 This ZIP has a lot of rail crossings: 12 public at-grade crossings, more than 87% of Ohio ZIPs. Source: FRA crossing inventory (Form 71, current)
Where does the tap water come from?
Where the tap water comes from and what is in it: the lake, river, reservoir or aquifer behind every tap, the plant that treats it, and what the compliance record and the lab results say about it.
Where the water comes from
Groundwater (wells)Groundwater from 12 wells along Eagle City Road in the Mad River buried-valley aquifer, pumped to the adjacent treatment plantSpringfield City Water Treatment Plant · Springfield City
Source: U.S. EPA SDWIS and Community Water System Service Area Boundaries (v3, 2026), Ohio EPA primacy data, 2020 census blocks: the system serving most residents, traced through purchases to the treating utility; Ohio EPA 2023 Sewer and Water… · EPA SDWIS · EPA service area boundaries · Ohio EPA drinking water · Ohio EPA rate survey
Springfield City is owned by a local government, with 26,485 service connections serving 60,680 people; it has substantially implemented source water protection under Ohio's program. Office: 937-525-5880 (SDWIS).
Bills, 2023: a household using 5,000 gallons a month paid about $247 a year for water ($21 a month; $144 at 2,500 gallons, $369 at 8,000) and about $624 a year for sewer (Ohio EPA rate survey, inside-city rates).
Ohio EPA loans since 2016 for projects inside this ZIP: $3.7 million across 11 projects, $2.6 million of it forgiven (drinking water $2.3M, nonpoint runoff $1.4M); largest: 2023 LSL Water Service Repl - Fountain Ave. (Springfield, 2023, $1.8M); West High Street Water Services (LSL) (Springfield, 2026, $429K); Clark County Combined Health District HSTS Program 2026 (Clark County, 2026, $200K).
- Aquifer
- Mad River Valley Buried Aquifer
- Water bodies
- Mad River
- Active wells
- 12
- Serves
- 60,680 people · Clark County
- EPA ID
- OH1204412
Springfield's Eagle City Road well field (12 wells) draws groundwater from the Mad River Buried Valley Aquifer, a watercourse aquifer recharged largely by the adjacent Mad River.
About this area's water
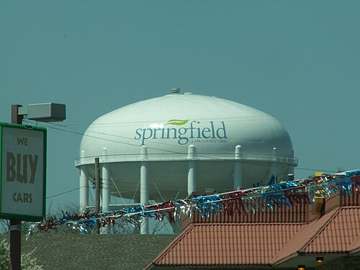
Did you know
- Each of Springfield's 12 wells can pump 3.5 million gallons a day from 100-115 feet down, feeding a plant rated for 36 MGD that actually averages about 9.
- The raw water is genuinely hard — about 347 mg/L — and lime softening cuts it to roughly 147 mg/L, from 20.2 grains per gallon down to 8.6.
- Water moves through two parallel treatment trains, each 100 feet wide and 465 feet long and each able to handle 18 million gallons a day.
- In 2025 the plant produced just over 3.5 billion gallons, and its first PFAS test found PFOS at 2.80 parts per trillion against a brand-new federal limit of 4.
History4
- 1882The City of Springfield's first public water system was established (not 1801, which is the city's founding date).
- 1958The Eagle City Road water treatment plant was constructed, replacing the older Pumphouse Road treatment facility.
- 2025The plant produced 3,504,231,000 gallons of potable water, met or exceeded all drinking water standards, and held an Unconditional License to Operate.
- 2025First PFAS sampling event under the 2024 federal PFAS rule was completed October 16, 2025; PFOS was detected at 2.80 ppt against the new 4 ppt MCL, all other regulated PFAS non-detect.
Treatment & pressure
How it is treated
Groundwater from 12 wells (100-115 ft deep) along Eagle City Road in the Mad River Buried Valley Aquifer feeds two parallel treatment trains rated 18 MGD each: lime for softening, ferric sulfate to remove excess lime and suspended solids, coagulation/flocculation and sedimentation, filtration…
Water pressure
not published — no citywide psi figure in the sources reviewed. The 2021 annual report notes an eastern pressure district expansion and booster pump station work, confirming…
What it costs
Not substantiated. The city references a Water and Sewer Customer Fee Schedule PDF but publishes no readable per-ccf or per-1,000-gallon figure. The 2025 rate-increase article…
Water quality & impurities8
| Contaminant | Level | Limit | Year |
|---|---|---|---|
| Total Trihalomethanes (TTHM) Disinfection byproduct; range 20.6-23 ppb, well under the MCL. | 23 ppb | 80 | 2025 |
| Haloacetic Acids (HAA5) Disinfection byproduct; range 1.6-3.9 ppb, far under the MCL. | 3.9 ppb | 60 | 2025 |
| Nitrate Roughly a tenth of the MCL despite an agricultural recharge area. | 1.11 ppm | 10 | 2025 |
| PFOS Detected below but close to the new federal MCL; other five regulated PFAS non-detect. | 2.80 ppt | 4 | 2025 |
| Lead (90th percentile) 0 of 32 samples above the action level. | 0.00 ppb | 15 (action… | 2023 |
| Copper (90th percentile) 0 of 32 samples above the action level. | 0.0059 ppm | 1.3 (action… | 2023 |
| Fluoride Well under the MCL. | 0.22 ppm | 4 | 2023 |
| Barium Naturally occurring; about 1% of the MCL. | 0.0221 ppm | 2 | 2023 |
EPA compliance record
Lead at the tap: 90th-percentile result 0 ppb in 2023 (action level 15 ppb).
EPA record: no health-based violations since 2015.
2 violations of any kind logged since 2020, 2 of them paperwork (monitoring, reporting, public notice or consumer report).
Projects & plans4
Recent and current work
- Water treatment plant and well field capital work · 2021 · completed
Eastern pressure district expansion, four high service pump replacements, four lime slaker replacements, rehabilitation of three wells, and removal of 12… - Lead and Copper Rule service line inventory · completed
Public service line inventory published online, listing material types by address. - PFAS monitoring under the 2024 federal PFAS rule · 2025 · under construction
First of the required sampling events completed October 16, 2025; monitoring program runs to the April 26, 2027 deadline.
Planned or needed
- Continued PFAS compliance monitoring · 2027 · planned
Federal rule requires finished-water PFAS monitoring completed by April 26, 2027; PFOS at 2.80 ppt sits just under the 4 ppt MCL.
Supply stress
The Mad River Buried Valley Aquifer well field has limited natural protection from infiltrating contaminants, and the city's CCR states the aquifer has a high susceptibility to contamination. The well field sits along the Mad River at Eagle City Road. Pressure is on source quality and a PFOS result near the new MCL, not on supply…
Sewers
Sanitary
The City of Springfield operates its own wastewater treatment plant discharging to the Mad River. Older parts of the collection system are combined, and combined sewer overflows are addressed under an Ohio EPA Long Term Control Plan update.
Storm
Stormwater in older neighborhoods moves through the combined sewer system, addressed under the same Long Term Control Plan. Plant staff also maintain open storm channels, including the U.S. 68 channel and Red Coach drainage tributary.
Sourcesverified
Compiled from the utility's own reports and public records, then independently re-checked against primary sources.
Water systems in this ZIP
- Springfield City80% of residentsMad River Buried Valley Aquifer (12 wells)
20% of residents live outside every mapped system, most likely on private wells.
Source: U.S. EPA SDWIS and Community Water System Service Area Boundaries (v3, 2026), Ohio EPA primacy data, 2020 census blocks: the system serving most residents, traced through purchases to the treating utility; Ohio EPA 2023 Sewer and Water Rate Survey (Ohio State, May 2025) for household bills; Ohio EPA DEFA loan awards since 2016 for the loans paragraph · EPA SDWIS · EPA service area boundaries · Ohio EPA drinking water · Ohio EPA rate survey
Infrastructure in this ZIP
10.2 mi of highway (SR 4, US 68, I-70) · 4.45 mi of railroad (Indiana & Ohio Railway, Norfolk Southern) · 3 transit routes (Springfield City Area Transit) · 2.55 mi of gas transmission pipeline (Columbia Gas Transmission (TC Energy)) · 1.55 mi of oil, fuel or NGL pipeline (Marathon Pipe Line) · 12.7 mi of electric transmission line (AES Ohio (DP&L)) · 7.98 mi of large water mains mapped (City of Springfield) · 15.4 mi of interceptor sewer mapped (City of Springfield) · 1 sewage plant (City of Springfield WWTP) · 2 combined sewer overflows · 1 dam (Hosterman Lake Dam) · 2 substations · 14 grade crossings (Norfolk Southern, Indiana & Ohio Railway) · 1 registered tower · 4 landfills or waste sites, open and closed (Springfield Landfill, Waste Management Springfield Landfill, Mad River Topsoil Inc) · 1 fire or EMS station · 1 police station · 1 USGS stream gauge (Mad River near Springfield OH) · 1 water works or pumping station in OpenStreetMap · 10.2 mi of trail and bike route · 17 transit stops · 27 bridges and culverts in the inventory · 8 sites with underground fuel tanks in use · 3 open leaking-tank releases · 4 other permitted dischargers (Boone Saloon, Buckeye Resources Inc, C&s Treee Recycling Center) · 1 quarry or pit (Enon Sand & Gravel, Llc).
Draw them26 layers on the mapIntakes and plants
Groundwater (wells)Groundwater from 12 wells along Eagle City Road in the Mad River buried-valley aquifer, pumped to the adjacent treatment plantSpringfield City Water Treatment Plant · Springfield City
Source: U.S. EPA SDWIS and Community Water System Service Area Boundaries (v3, 2026), Ohio EPA primacy data, 2020 census blocks: the system serving most residents, traced through purchases to the treating utility; Ohio EPA 2023 Sewer and Water… · EPA SDWIS · Ohio EPA source water protection
Full detail
Springfield City is owned by a local government, with 26,485 service connections serving 60,680 people; it has substantially implemented source water protection under Ohio's program. Office: 937-525-5880 (SDWIS).
Bills, 2023: a household using 5,000 gallons a month paid about $247 a year for water ($21 a month; $144 at 2,500 gallons, $369 at 8,000) and about $624 a year for sewer (Ohio EPA rate survey, inside-city rates).
Ohio EPA loans since 2016 for projects inside this ZIP: $3.7 million across 11 projects, $2.6 million of it forgiven (drinking water $2.3M, nonpoint runoff $1.4M); largest: 2023 LSL Water Service Repl - Fountain Ave. (Springfield, 2023, $1.8M); West High Street Water Services (LSL) (Springfield, 2026, $429K); Clark County Combined Health District HSTS Program 2026 (Clark County, 2026, $200K).
- Aquifer
- Mad River Valley Buried Aquifer
- Water bodies
- Mad River
- Active wells
- 12
- Serves
- 60,680 people · Clark County
- EPA ID
- OH1204412
Springfield's Eagle City Road well field (12 wells) draws groundwater from the Mad River Buried Valley Aquifer, a watercourse aquifer recharged largely by the adjacent Mad River.
About this area's water
Water systems in this ZIP
- Springfield City80% of residentsMad River Buried Valley Aquifer (12 wells)
20% of residents live outside every mapped system, most likely on private wells.
Source: U.S. EPA SDWIS and Community Water System Service Area Boundaries (v3, 2026), Ohio EPA primacy data, 2020 census blocks: the system serving most residents, traced through purchases to the treating utility; Ohio EPA 2023 Sewer and Water Rate Survey (Ohio State, May 2025) for household bills; Ohio EPA DEFA loan awards since 2016 for the loans paragraph · EPA SDWIS · Ohio EPA source water protection
Infrastructure in this ZIP
10.2 mi of highway (SR 4, US 68, I-70) · 4.45 mi of railroad (Indiana & Ohio Railway, Norfolk Southern) · 3 transit routes (Springfield City Area Transit) · 2.55 mi of gas transmission pipeline (Columbia Gas Transmission (TC Energy)) · 1.55 mi of oil, fuel or NGL pipeline (Marathon Pipe Line) · 12.7 mi of electric transmission line (AES Ohio (DP&L)) · 7.98 mi of large water mains mapped (City of Springfield) · 15.4 mi of interceptor sewer mapped (City of Springfield) · 1 sewage plant (City of Springfield WWTP) · 2 combined sewer overflows · 1 dam (Hosterman Lake Dam) · 2 substations · 14 grade crossings (Norfolk Southern, Indiana & Ohio Railway) · 1 registered tower · 4 landfills or waste sites, open and closed (Springfield Landfill, Waste Management Springfield Landfill, Mad River Topsoil Inc) · 1 fire or EMS station · 1 police station · 1 USGS stream gauge (Mad River near Springfield OH) · 1 water works or pumping station in OpenStreetMap · 10.2 mi of trail and bike route · 17 transit stops · 27 bridges and culverts in the inventory · 8 sites with underground fuel tanks in use · 3 open leaking-tank releases · 4 other permitted dischargers (Boone Saloon, Buckeye Resources Inc, C&s Treee Recycling Center) · 1 quarry or pit (Enon Sand & Gravel, Llc).
Draw them26 layers on the mapViolations
No health-based violations since 2015No health-based violations since 2015Springfield City · lead 0 ppb (2023) · 2 of any kind since 2020
Source: EPA SDWIS (Envirofacts, pulled September 2026): health-based violations since 2015, all violations since 2020, lead and copper 90th-percentile results, for the system serving most of the ZIP · EPA SDWIS (Envirofacts) · EPA ECHO
Full detail
Drinking-water compliance
Lead at the tap: 90th-percentile result 0 ppb in 2023 (action level 15 ppb).
EPA record: no health-based violations since 2015.
2 violations of any kind logged since 2020, 2 of them paperwork (monitoring, reporting, public notice or consumer report).
A health-based violation is a contaminant above its limit or a treatment rule not followed; monitoring, reporting and public-notice violations are paperwork. Lead is the 90th-percentile result across sampled homes, not a reading at any one tap.
Source: EPA Safe Drinking Water Information System (Envirofacts, pulled September 2026), violations and lead and copper sampling for the system that serves most of this ZIP · EPA SDWIS (Envirofacts) · EPA ECHO
Disinfection byproducts
40 to 60TTHM 44 µg/L (2019)Springfield City · HAA5 5 · worst year 44
Source: EPA Six-Year Review 4 compliance monitoring data, 2012 to 2019: total trihalomethanes and haloacetic acids (HAA5) sampled in the distribution system, nitrate, arsenic, combined radium, gross alpha and uranium at entry points; yearly means…
Full detail
Byproducts and contaminants
- TTHM
- 44 µg/L yearly mean in 2019, the last year in the file (limit 80); worst yearly mean 44, highest single sample 60; 80 samples from 2012 to 2019
- HAA5
- 4.8 µg/L yearly mean in the last year sampled (limit 60); worst yearly mean 8.8, highest sample 10.5; 80 samples
- Nitrate
- highest of 8 samples was 2.29 mg/L as nitrogen (2015; limit 10); 0.94 in 2019, the last year sampled. Nitrate above 10 is unsafe for infants
- Arsenic
- not detected in 2 samples (limit 10)
- Solvents and fuels
- benzene, carbon tetrachloride, 1,2-dichloroethane, trichloroethylene, tetrachloroethylene, vinyl chloride not detected in 2 samples
- Bacteria
- 4 of 6,916 routine tap samples (0.06%) tested positive for total coliform in 2012 to 2019, 1 of 864 in 2019; E. coli never found in the 4 tap samples tested for it. Coliform itself is a warning sign; E. coli means sewage or manure reached the water
- Farm chemicals
- atrazine, alachlor not detected in 2 samples
- Metals
- barium in 2 of 2 samples, highest 19.9 µg/L (limit 2,000); chromium, cadmium, mercury, selenium, thallium not detected in 2 samples
EPA's file stops at 2019; Ohio EPA's Drinking Water Watch has newer results. Byproducts are judged on running yearly averages at each sampling site, so one high sample is not a violation. Nitrate and arsenic are measured where water enters the pipes.
Source: EPA Six-Year Review 4 compliance monitoring data, 2012 to 2019 (TTHM, HAA5 and coliform from distribution-system samples of Springfield City; nitrate, arsenic, radionuclides, solvents, herbicides and metals from the entry points of the same system); non-detects counted as zero
PFAS
No PFAS detectedNo PFAS detectedSpringfield City · UCMR 5, 2 samples · Ohio EPA 2020
Source: EPA UCMR 5 occurrence data (final release, August 2026: 29 PFAS and lithium at 347 Ohio systems) and Ohio EPA statewide PFAS sampling 2019 to 2021 (1,479 systems), for the system serving most of each ZIP; Ohio EPA water treatment plant… · Ohio EPA PFAS
Full detail
PFAS
- UCMR 5
- 2 samples in 2023 to 2024 at the entry point to the distribution system: none of the 29 PFAS detected
- Ohio EPA 2020
- 1 plant tested (latest 2020-07): nothing detected for the six PFAS tested
- Ohio EPA latest
- 1 plant sampled by Ohio EPA, most recently 2026-04 (Ohio EPA statewide sampling status map)
Firefighting foam: 2 fire departments or other holders in Clark County registered 425 gallons of PFAS-based AFFF foam with Ohio EPA, 330 gallons in opened containers; the state is collecting it for disposal so it is never sprayed again.
Lithium: not detected in 2 UCMR 5 samples at Springfield City (the method reports from 9 µg/L). Lithium is unregulated; EPA's draft health reference level is 10 µg/L, and it occurs naturally in deep groundwater, so well systems in the northwest run highest.
PFAS are the forever chemicals from firefighting foam, plating shops and non-stick coatings. One sample above 4 ng/L is not a violation; compliance is judged on running annual averages, and systems are adding carbon filters ahead of the 2029 deadline. Results are for water leaving the plant, not your tap.
Source: EPA UCMR 5 occurrence data (final release, August 2026) and Ohio EPA statewide PFAS sampling 2019 to 2021 and its current status map, for the system that serves most of this ZIP; EPA SDWIS record OH1204412; results in nanograms per litre (parts per trillion) · Ohio EPA PFAS
Lead
No lead detectedNo lead at the 90th-percentile tapSpringfield City · period ending 2023-12 · 1,871 of 23,550 service lines lead or galvanized, 19,444 unknown
Source: SDWIS lead and copper 90th-percentile tap results (Envirofacts) and EPA's service line inventory dashboard (2026 Q2 submissions), for the system serving most of each ZIP; Ohio Department of Health high-risk ZIP code list for childhood… · ODH childhood lead testing · ODH high-risk ZIP list (CCBH PDF) · Ohio EPA lead and copper · H2Ohio
Full detail
Lead at the tap
- Latest period
- 0 ppb in the sampling period ending 2023-12
- Record
- 3 sampling periods since 2016, none above 10 ppb
- Service lines
- 23,550 inventoried: 433 lead, 1,438 galvanized needing replacement, 19,444 unknown, 2,235 not lead (reported all required service line types)
Children: the Ohio Department of Health lists this ZIP as high-risk for childhood lead exposure, mostly from old paint and soil, so every child living here should get a blood lead test at ages 1 and 2 (Medicaid covers it, and doctors are required to order it).
Housing age: 68% of the homes here were built before 1960 and 40% before 1940, when lead service lines, lead solder and lead paint were common; 90% predate 1980 (Census ACS 2020 to 2024).
Systems sample taps in the homes most likely to have lead pipes or solder; the 90th-percentile figure means nine in ten sampled homes were at or below it. Lead comes from the service line and the house plumbing, not the source water, so a low system result does not clear an old house. The action level drops from 15 to 10 ppb in 2027, and every lead line must be replaced within ten years of that.
Source: EPA Safe Drinking Water Information System lead and copper 90th-percentile results (Envirofacts) and EPA's service line inventory dashboard (2026 Q2), for Springfield City (OH1204412), the system that serves most of this ZIP · ODH childhood lead testing · ODH high-risk ZIP list (CCBH PDF) · Ohio EPA lead and copper · H2Ohio
Fluoride and treatment
Not fluoridatedNot fluoridatedSpringfield City · corrosion control, coagulation and settling, chlorine disinfection, lime softening
Source: CDC My Water's Fluoride (fluoridation status of each system as reported by the Ohio Department of Health, fetched 2026-09-10); SDWIS treatment table (Envirofacts): each system's registered treatment steps, inherited from the supplier for… · EPA SDWIS search
Full detail
Fluoride and treatment
Treatment on file: corrosion control, coagulation and settling, chlorine disinfection, lime softening, sand or media filtration.
The health department reports 0.22 mg/L of natural fluoride for Springfield City, below the 0.7 mg/L target.
Measured fluoride: none detected in 2 samples at the plant's entry points in 2012 to 2019 (EPA compliance monitoring).
The health department counts 28.7% of Clark County residents on community water as receiving fluoridated water.
Ohio law (ORC 6109.20, 1969) makes systems serving 5,000 or more people fluoridate unless the water already carries 0.8 mg/L naturally or the community exempted itself by ordinance or referendum in the months after the law passed; smaller systems choose for themselves. The treatment list is what each system registered with EPA and can lag a plant upgrade.
Source: CDC My Water's Fluoride, fluoridation status of each system as reported by the Ohio Department of Health; EPA Safe Drinking Water Information System treatment table for Springfield City (OH1204412); EPA Six-Year Review 4 compliance monitoring, 2012 to 2019; Ohio Department of Health fluoridation report (DataOhio) for the county share · EPA SDWIS search
Algal toxins
No dataGroundwater system, not monitored for algal toxins
Source: Ohio EPA public water system harmful algal bloom monitoring (geo.epa.ohio.gov DrinkingWater/HAB): microcystin results in raw and treated water since 2016 for surface-water systems, for the system serving most of each ZIP · Ohio EPA HAB information for public water systems
Full detail
Algal toxins
Springfield City draws groundwater, which Ohio does not monitor for algal toxins; blooms are a surface-water problem.
Source: Ohio EPA public water system harmful algal bloom monitoring (HAB data and map, DrinkingWater/HAB service, fetched 2026-09-09), total microcystins by ELISA in raw and treated water, for the system that serves most of this ZIP · Ohio EPA HAB information for public water systems
Groundwater
120 to 140DRASTIC 129 · Limestone883 well logs · median 77 ft deep · 40 karst and spring points
Source: ODNR Division of Geological Survey: DRASTIC groundwater vulnerability polygon at each ZIP's population center, mapped karst features, and the state water well log inventory (about 655,000 logs) counted inside each ZIP; ODNR glacial… · ODNR Geological Survey · Ohio EPA GIS services · USGS water data
Full detail
Groundwater
- Under the surface
- till over sand and gravel, part of the Xenia Ground Moraine Aquifer (ground moraine setting); wells there yield 5 - 25 gallons a minute, deposits 25 - 100 ft thick
- Bedrock
- Tymochtee and Greenfield Dolomites, yielding 0 - 5 gpm to a well
- Setting
- Limestone; water table 15-30 ft down, 4-7 in/yr recharge, clay loam soil (hydrogeologic setting 7Ac); pesticide index 147
- Karst
- 40 karst and spring points in ODNR's inventory inside the ZIP (33 field-verified), 3.3 per square mile
- Well logs
- 883 drilled wells on file (66.2 per 1,000 residents), median 77 ft deep, 15 gallons a minute median test yield, water 23 ft down
- Aquifers
- 84% of wells in bedrock, 16% in sand, gravel and other unconsolidated material; typical well drilled 1988, 226 since 2000; uses: Domestic 698, Monitor 82
- Wellhead protection
- 12% of this ZIP lies inside Ohio EPA source water protection areas for 16 public water systems (Enon Heights Mhp PWS, Evergreen Edgewood Mhp PWS, Enon Village PWS); the largest, Boone Saloon, is rated high with water quality impacts susceptibility in a karst setting
- Geology
- 47% of the ZIP is a sensitive geologic setting, where thin or sandy cover leaves the aquifer open to what soaks in from the surface; its population center sits on Silurian-Devonian limestone and dolomite known to form karst, under less than 20 ft of drift; 24 field-verified sinkholes and 7 probable sinkholes inside the ZIP, where surface water can pour straight into the aquifer; 8 verified springs (Ohio EPA and ODNR Geological Survey)
- Injection wells
- 54 Class V injection wells on Ohio EPA's books inside this ZIP (10 active): 10 large septic, 28 cleanup injection, 1 vehicle waste, 15 other; these put fluids underground above or into drinking water aquifers
- Urban setting
- 4 Ohio EPA Urban Setting Designation areas touch this ZIP (Springfield, City of): a finding that groundwater there is not used for drinking, which lets contaminated sites close without cleaning the aquifer to drinking standards
- Water table
- CL-7 OH monitoring well (ODNR), 4.8 mi away: water 11.5 ft below ground on 2026-07-26; averaged 10.9 ft in 2015 to 2019 and 11.4 ft over the latest year, so the table is running about 0.5 ft lower; range 6.3 to 13 ft over 4,166 readings since 2015
- Nitrate risk
- EPA researchers put the chance that a public water system in the Mill Creek subwatershed exceeds the nitrate limit at 33% if it draws on groundwater and 41% if it draws on rivers or lakes, judged from land use, geology and past results (EnviroAtlas nitrate violation index; the typical Ohio subwatershed scores 23% for groundwater and 39% for surface water)
- Quality monitoring
- Ohio EPA's nearest ambient groundwater monitoring well is Springfield WTP (Clark County), 4.7 mi away: 96 ft deep in sand and gravel (Mad River aquifer); wells there yield over 500 gallons a minute; sampled on the standard cycle. 11 active wells within 15 mi
Vulnerability rates how easily a spill at the surface reaches the aquifer, not whether anything has. Well logs include abandoned and replaced wells, so counts overstate wells in use; a private well owner is the only one who tests it.
Source: ODNR Division of Geological Survey, Groundwater Vulnerability (DRASTIC) map (polygon at the ZIP's population-weighted center), karst feature inventory, and the Ohio water well log database (logs inside the ZIP boundary) · ODNR Geological Survey · Ohio EPA GIS services · USGS water data
Aquifer
30 to 60%47% sensitive geologic settingkarst-prone bedrock, thin drift at the center · 24 verified sinkholes · 12% wellhead protection
Source: Ohio EPA Sensitive Geologic Settings (geology/Geology layer 0) intersected with ZCTA polygons; ODNR karst geology at the ZIP center (layer 7, point query) and karst and spring points (layer 5); Ohio EPA source water protection areas… · Ohio EPA geology layers · Ohio EPA source water protection (SWAP) · ODNR Geological Survey
Full detail
Aquifer exposure
- Karst
- the population center sits on Silurian-Devonian limestone and dolomite known to form karst, under less than 20 ft of drift; 24 field-verified and 7 probable sinkholes inside the ZIP, 8 verified springs; nearest verified sinkhole 1.4 mi from the center
- Wellhead protection
- 12% of the ZIP lies inside Ohio EPA source water protection areas for 16 public water systems (Enon Heights Mhp PWS, Evergreen Edgewood Mhp PWS, Enon Village PWS); the largest, Boone Saloon, is rated high with water quality impacts susceptibility in a karst setting
- Vulnerability index
- DRASTIC 129 (ODNR; higher means a spill at the surface reaches the aquifer more easily)
Sensitive settings are outwash plains, buried valleys, karst and shallow bedrock, mapped statewide by Ohio EPA for siting decisions. Exposure is not contamination: it says how quickly a spill, a failing tank or heavy manure would reach the water table, not whether one has.
Source: Ohio EPA Sensitive Geologic Settings and karst geology layers (geology/Geology), ODNR Geological Survey karst and spring points, Ohio EPA source water protection areas (DrinkingWater/SWAP); shares by ZIP boundary overlay, karst by a point query at the population-weighted center · Ohio EPA geology layers · Ohio EPA source water protection (SWAP) · ODNR Geological Survey
Sewage plants
Every quarter in violationCity of Springfield Wwtp · 1 mi12 of 12 quarters in violation · combined sewer overflows · 25 MGD
Source: EPA ECHO Clean Water Act facilities, Ohio NPDES permits with a publicly owned treatment works component, plants of 0.1 MGD or more or designated major: nearest plant, design flow, significant-noncompliance status, quarters in… · EPA ECHO · EPA CSO inventory · Ohio EPA GIS services · EPA Facility Finder
Full detail
Sewage treatment
- Size
- 25 million gallons a day design flow; a major facility; the system has combined sewer overflows
- Compliance
- 12 of the last 12 quarters with a violation; currently in violation (not significant); 2 effluent limit exceedances in 3 years
Combined sewer overflows: 46 outfalls inside this ZIP, 61 within 3 miles, permitted to City of Springfield Wwtp. In heavy rain these release untreated sewage mixed with storm water.
Other discharge permits: 3 facilities inside this ZIP other than sewage plants hold a Clean Water Act permit (factories, water plants, quarries, package plants, storm water); 9 facility-quarters with a violation in the last three years; largest: C&S Treee Recycling Center (0.014 MGD).
Sewage sludge: 3 farm fields covering 152 acres inside this ZIP are permitted for spreading treated biosolids, mostly from Dayton Wwtp (87 acres), Xenia Ford Road Wwtp (65 acres) (Ohio EPA). Biosolids carry nutrients and, increasingly under scrutiny, PFAS.
Sludge source: 1 permitted biosolids generator is inside this ZIP; nearest Springfield Waste Water Treatment, 1.1 mi away (a major plant); 5 within 10 miles (Ohio EPA).
State water loans: 11 projects inside this ZIP have borrowed $3.7 million from Ohio EPA's revolving loan funds since 2018 (9 sewer, storm water and runoff projects for $1.4 million; 2 drinking water projects for $2.3 million), with $2.6 million of principal forgiven. Largest: 2023 LSL Water Service Repl - Fountain Ave. (Springfield, 2023, $1.8 million); latest: West High Street Water Services (LSL) (Springfield, 2026, $428,769). Below-market loans are how most Ohio treatment plants and water mains get rebuilt.
Sewer planning: 68% of it is assigned to Clark County as the designated sewage management agency under Ohio's Clean Water Act section 208 plan (generic prescriptions); 2 agencies share the ZIP. The 208 plan decides who may build and extend sewers.
Stormwater: 59% of this ZIP lies inside Ohio EPA's regulated MS4 areas, mostly the City of Springfield storm sewer system (3 permit holders overlap the ZIP); the towns, townships and counties that own those storm sewers hold a stormwater permit and must control what runs off streets and parking lots (2020 to 2030 designation). 8 sites with an address in this ZIP hold their own industrial stormwater permits (All Cans - Can Happen, United Parcel Service, Walts Auto Inc and others) (EPA Facility Finder).
Plants inside this ZIP: City of Springfield Wwtp (25 MGD, major, CSO).
Where a home's sewage actually goes depends on the sewer district, and rural homes are on septic systems the county health department permits; the nearest plant is a proxy. Violations range from paperwork to raw discharges.
Source: EPA Enforcement and Compliance History Online (ECHO), Clean Water Act NPDES facilities with a POTW component in Ohio; straight-line miles from the ZIP's population-weighted center. Compliance data lag about a quarter.; other Clean Water Act permit holders inside the ZIP from the same service · EPA ECHO · EPA CSO inventory · Ohio EPA GIS services · EPA Facility Finder
Stream health
A quarter to a half42% of the land drains to streams failing aquatic lifeMill Creek · unknown cause, bacteria (pathogens)
Source: EPA ATTAINS, Ohio 2024 Integrated Report assessment units (1,545 watershed polygons) overlaid on ZCTAs in Albers equal-area with the Lake Erie units clipped out: share of land in units not supporting aquatic life, recreation, fish… · EPA ATTAINS · Ohio integrated report · Ohio sport fish advisory · Ohio EPA advisory map
Full detail
Stream health
- Uses failing
- aquatic life 42% of the land, recreation (bacteria) 93%, fish consumption 96%
- Causes listed
- unknown cause (96%), bacteria (pathogens) (93%), habitat damage (42%)
- Cleanup plans
- 100% of the land is under a TMDL pollution budget
Watersheds here: Mill Creek (not supporting); Rock Run-Mad River (not supporting).
Fish advisories (Ohio EPA): Mad River (U.S. Route 36, Urbana, to mouth (Great Miami River) (Champaign, Clark, Greene, Montgomery Counties)): channel catfish one meal a month, largemouth bass one meal a month, brown trout two meals a week (PCBs, mercury). Statewide, every other fish is one meal a week because of mercury.
Nearest stream assessment (Ohio EPA): Trib To N Fk L Miami R (5.60) S Of Springfield @ Crabill Rd. on the Trib. To N. Fk. Little Miami R. (5.60), 4.4 mi away, draining 7 square miles: partial attainment of its warmwater use; fish IBI 32 of 60 (2011); bugs rated marginally good; habitat QHEI 37.3 of 100. 0 within 3 miles, 15 within 10. Scores above about 40 (IBI), 36 (ICI) and 60 (QHEI) mean a healthy warmwater stream.
Stream designations (Ohio EPA water quality standards): 9.2 miles of designated streams cross this ZIP: 9.2 mi warmwater habitat. Nearest specially protected stream: the North Fork Little Miami river, 4.7 mi away, an Outstanding State Water. Exceptional and coldwater streams are the state's healthiest; modified and limited-resource waters are channelized or ditched.
Proposed for 2026: Ohio EPA's pending water quality standards rewrite would add 5.4 miles of stream in this ZIP to the antidegradation tiers: the Mad River as Outstanding State Water for recreation (Macochee creek (RM 51.75) to the mouth). Listing raises the bar for any new or expanded discharge.
PFAS in the river (Ohio EPA large river survey): at Mad R. Near Enon @ Snider Rd., 7.4 mi away, the water carried 434.8 ng/L of total PFAS (PFOA 2.2, PFOS 100 ng/L). Drinking water limits are 4 ng/L for PFOA and PFOS; river water is not drinking water, but treatment plants that draw from it start from these numbers.
Farm chemicals (USGS estimate, 2018): farms in Clark County used about 167 metric tons of pesticide active ingredient, 415 kg per square mile, 30th of Ohio's 88 counties. Largest: glyphosate 57 t, atrazine 35 t, acetochlor 16 t, metolachlor 15 t, 2,4-D 9 t. Atrazine, the corn herbicide, is the pesticide that most often shows up in Ohio tap water after spring rains; this county used 35 t of it.
Farms (2022 Census of Agriculture): 833 farms work 170,922 acres of Clark County, with 56.3% of its land in cropland, 205 acres to a farm. 14,487 cattle, 43,198 hogs, 2,438 laying hens, 4,338 broilers, 8 turkeys; 62,886 acres of corn and 66,716 of soybeans. Sales $196 million, 28% from animals and animal products. Manure and fertilizer from farms like these carry the phosphorus and nitrogen behind Ohio's algae and nitrate problems; withheld figures protect individual farms.
A watershed unit fails when any sampled stream in it fails; ditches in flat farm country fail on habitat and nutrients, city creeks on bacteria and sediment. Ohio's own report is at epa.ohio.gov; the EPA link on each unit's report page has the sampling detail.
Source: EPA ATTAINS (Ohio EPA 2024 Integrated Report), watershed assessment units overlaid on the ZIP boundary in an equal-area projection; shares are of the ZIP's land area · EPA ATTAINS · Ohio integrated report · Ohio sport fish advisory · Ohio EPA advisory map
Watershed
Drains to the Ohio RiverUpper Great Miami, Indiana, Ohio subbasinMill Creek · drains to the ohio river
Source: USGS Watershed Boundary Dataset: HUC-8 subbasins by resident share (2020 census blocks) and the HUC-12 subwatershed at each ZIP's population-weighted center with its downstream chain; USGS county water use 2015 (Dieter and others 2018) for… · USGS watershed boundaries · EPA EnviroAtlas · Ohio EPA 401 map · USGS county water use 2015 · ODNR H2Ohio projects · ODNR Lake Erie Coastal Management Area · Ohio EPA source water protection (SWAP) · Ohio EPA nine-element plans · Ohio EPA 319, GLRI and SWIF project lists · Ohio EPA chloride reduction grants · NOAA Lake Erie water levels
Full detail
Watershed
- Upper Great Miami, Indiana, Ohio100% of residentsDrains to the Ohio River
H2Ohio: nearest project Rainbow Run III, Off-channel, funded 2024, in progress, 6.1 mi away: This project is the third H2Ohio project to expand the Rainbow Run Wetlands in Clark County. This project connects to the previous wetland projects, increasing ...; 0 within 5 miles, 3 within 15. H2Ohio pays for wetlands, farm practices and lead line work to cut the nutrients behind Lake Erie's algae.
Source water: 100% of this ZIP drains to the river intake of Dayton Public Water System and sits inside its Ohio EPA source water protection area.
Watershed grants: nearest "Runoff Reduction & Education at National Trail Park" by City of Springfield (stormwater management, SWIF), 3.2 mi away; 1 within 10 miles (Ohio EPA project lists: Section 319 and GLRI through fiscal 2023, SWIF through 2017).
Road salt: nearest went to City of Springfield (equipment, 2024-2025), 1.5 mi away; 1 in Clark County. H2Ohio pays for brine makers, calibrated spreaders and covered salt barns so less chloride reaches streams and wells.
The population center sits in the Mill Creek subwatershed; its water runs on through Rock Run-Mad River, then Jackson Creek-Mad River, then Huffman Dam-Mad River.
In 2015 Clark County drew about 25 million gallons a day of fresh water (USGS): 16.2 million for public supply (100% from wells, 96,200 people served at 118 gallons a person a day at home), 0.1 million for industry, 4.7 million for irrigation, 0.3 million for mining; 39,700 residents drew their own well water.
EnviroAtlas, Mill Creek: under 50 acres in the Conservation Reserve Program; 4,052 acres of grain crops; 15 miles of streams (0.9 per square mile); water use of 1.4 million gallons a day for homes and 206 thousand for farms; 41 inches of rain and snow a year; 10.3 kg of nitrogen per hectare falling from the air each year; farm nitrogen of 0 kg per hectare a year as manure and 33 kg as synthetic fertilizer; 14% of the farmland sits on drained hydric soils; potentially restorable wetlands on farmland cover 24% of the subwatershed; 13% of the land is paved or roofed; 39% of the stream banks keep natural cover (EPA EnviroAtlas national metrics, 2010s vintages).
Stream permits: none of this ZIP drains to streams Ohio EPA rates high quality, where a project that fills, pipes or crosses a stream needs an individual Ohio EPA 401 water quality review; 4% drains toward high-quality waters farther down and might qualify for the Army Corps' blanket nationwide permits after a field screening and 96% can use those nationwide permits outright (Ohio EPA 401 nationwide permit eligibility map).
Source: USGS Watershed Boundary Dataset (HUC-8 subbasins by resident share, HUC-12 subwatershed at the population center) · 2020 census blocks · USGS watershed boundaries · EPA EnviroAtlas · Ohio EPA 401 map · USGS county water use 2015 · ODNR H2Ohio projects · ODNR Lake Erie Coastal Management Area · Ohio EPA source water protection (SWAP) · Ohio EPA nine-element plans · Ohio EPA 319, GLRI and SWIF project lists · Ohio EPA chloride reduction grants · NOAA Lake Erie water levels
Home
The houses themselves and what they cost: who lives in them, what a typical one looks like down to the parcel record, how much new housing has gone up, and what a household pays in property tax.
Homes and income
$100,000 to $175,000Median home $107,300household income $42,104 · rent $872 · 58% own
Source: Census ACS 2020-2024 5-year by ZCTA: median home value, median gross rent, median household income, owner share, median year built; Eviction Lab tract estimates 2016 to 2018 (Gromis and others 2022), population-weighted to ZIPs; HUD fiscal… · Census ACS · Eviction Lab · HUD data · IRS ZIP statistics · Mapping Inequality · HUD eGIS open data · FDIC BankFind · NCUA call report data
Full detail
Homes and income
- Household income
- $42,104 median
- Income spread
- 30% of households earn under $25,000 a year, 19% $100,000 or more and 3.1% $200,000 or more
- Rent
- $872 a month, median gross
- Owner-occupied
- 58% of 5,729 occupied homes; 57% of owners carry a mortgage
- Typical home built
- 1951
- Value spread
- 45% of owner-occupied homes are worth under $100,000 and 1.5% $500,000 or more; income per person $26,543 a year
- Moved in
- the typical owner moved in in 2005, the typical renter in 2018
- Median age
- 42.2 years
- Commute
- 20 minutes each way on average, 9% of commuters travel 45 minutes or more, 11% work from home
- Housing stock
- 75% single-family detached, 8% in buildings of 5 or more units; 3.8% of homes are crowded (more than one person a room)
- Vacancy
- 11% of 6,444 housing units are vacant: 0.7% for sale, 9.9% other, such as homes held off the market, in probate or abandoned
- Owner costs
- 20% of owners with a mortgage and 6% of owners without one spend 30% or more of income on housing
- Evictions
- 8.67 eviction filings a year per 100 renter households in 2016 to 2018, 6.26 ending in a judgement (about 219 filings a year; Eviction Lab)
- Fair market rent
- $1,120 a month for a two-bedroom (one-bedroom $850, three-bedroom $1,370): HUD's fiscal 2026 small-area fair market rent, the benchmark for housing vouchers in the Springfield MSA area
- Tax returns
- 5,600 returns for 2022 averaging $43,641 of adjusted gross income; 39% reported under $25,000 and 1% reported $200,000 or more; 29% claimed the earned income credit and 24% were filed by people 60 or older (IRS)
- Redlining
- 15% of this ZIP's area was graded on the federal Home Owners' Loan Corporation's late-1930s Springfield map: 1% grade A (best), 1% grade B (still desirable), 9% grade C (declining), 4% grade D (hazardous, the redlined areas)
- Subsidized housing
- 1 public housing development with 177 units (Springfield Metropolitan Housing Authority); 3 tax-credit (LIHTC) properties with 108 low-income units, newest placed in service 2014; 2 HUD-assisted multifamily properties with 144 assisted units (Section 8 and similar contracts). Housing vouchers used in private rentals are not counted
- Banks
- no bank branch inside this ZIP; the nearest, The Richwood Banking Company, is 1.5 mi from its center (FDIC); no credit union branch (NCUA)
- Strain
- 52% of renters pay 30% or more of income in rent; 15.2% of households have no vehicle; the median renter spends 30.9% of income on rent; the median owner with a mortgage spends 18.1% of income on housing costs
Five-year survey averages centered on 2022; small ZIPs carry wide margins of error, and owner-estimated values run below sale prices in a rising market.
Source: Census Bureau, American Community Survey 2020 to 2024 five-year estimates by ZIP Code Tabulation Area; Eviction Lab (Princeton) tract estimates 2016 to 2018, weighted to the ZIP; HUD fiscal 2026 Small Area Fair Market Rents; IRS Statistics of Income ZIP data, tax year 2022; Mapping Inequality (University of Richmond), HOLC maps 1935 to 1940; HUD eGIS open data for subsidized housing; FDIC BankFind branch locations; NCUA credit union branch list, March 2026 · Census ACS · Eviction Lab · HUD data · IRS ZIP statistics · Mapping Inequality · HUD eGIS open data · FDIC BankFind · NCUA call report data
House by house
1940 to 1959Median year built 19434,866 homes · $86K median appraised
Source: Residential parcels (Ohio land-use classes 500 to 599, apartments 401 to 403, farmhouses) placed in ZIPs by scripts/join_parcels.py on 2026-09-15, the houses loading on demand; county auditors' appraisal records, house by house (year… · Allen County Auditor · Ashland County Auditor · Auglaize County Auditor · Butler County Auditor · Champaign County Auditor · Clark County Auditor · Clinton County Auditor · Coshocton County Auditor · Crawford County Auditor · Fairfield County Auditor · Fayette County Auditor · Franklin County Auditor · Greene County Auditor · Guernsey County Auditor · Hardin County Auditor · Highland County Auditor · Hocking County Auditor · Holmes County Auditor · Jackson County Auditor · Knox County Auditor · Licking County Auditor · Logan County Auditor · Lorain County Auditor · Madison County Auditor · Marion County Auditor · Miami County Auditor · Montgomery County Auditor · Morrow County Auditor · Muskingum County Auditor · Perry County Auditor · Pickaway County Auditor · Richland County Auditor · Ross County Auditor · Stark County Auditor · Tuscarawas County Auditor · Union County Auditor · Wyandot County Auditor · OGRIP Ohio Statewide Parcels · Athens County subdivisions, town plats and additions (Athens County Auditor GIS) · Cincinnati Community Council Boundaries · Cincinnati Statistical Neighborhood Approximations (SNA), 2020 · Clark County recorded subdivision plats · Clermont County recorded subdivision plats · Cleveland Heights neighborhoods · Cleveland Statistical Planning Areas (SPAs) / neighborhoods · Columbus Communities · Columbus Community Planning Areas · Coshocton County subdivisions (recorded plats and town additions) · Dayton neighborhoods · Dublin Civic Associations · Franklin County recorded subdivision and condominium plats · Hamilton (Ohio) 17Strong neighborhoods · Lima neighborhood associations · Logan County subdivision and condominium plats · Madison County subdivisions (recorded plats) · Morgan County subdivision, addition and town plats · Muskingum County subdivision plats · Perry County subdivisions and town additions (recorded plat names on the county engineer's parcels) · Richland County subdivisions and condominiums (recorded plats, county GIS) · Sandusky neighborhoods · Stark County recorded allotment (subdivision) and condominium plats · Toledo neighborhood associations · Union County subdivision plats
Full detail
Houses and neighborhoods
- Homes
- 4,315 one-family houses, 483 two-family houses, 41 three-family houses, 2 manufactured homes, 25 farmhouses; also 53 apartment buildings and 195 other residential parcels
- Age
- 55% built before 1950, 95% before 1978 (1978: the year lead paint was banned for housing)
- Size
- median living area 1,332 sq ft; median lot 0.18 acres (condominiums left out)
- Value
- median appraised value $86,175 (tax year 2025): the county auditor's market value for property tax, not a sale price
- Sales
- 61 sales in the 12 months to Sep 12, 2026 (median $97,000); 356 sales in 5 years (median $110,000, $84 a sq ft). Counted: sales the auditor marked valid or has not yet reviewed (sales marked not valid, and unreviewed ones under $10,000, are left out), single-parcel sales of homes, one per house (its newest)
- Owners
- 18% company-owned
- Neighborhoods
- 0 neighborhoods and 244 subdivisions (details load below)
The houses load when you search, pick a filter or press the button (the pack for this part of the state, a few megabytes). Zoomed in on the map, each house of this ZIP draws as a dot that follows the search and filters.
Source: county auditors' appraisal records: Clark County Auditor (as of Sep 12, 2026); residential parcels placed in ZIPs by the atlas; owner names are not carried · Allen County Auditor · Ashland County Auditor · Auglaize County Auditor · Butler County Auditor · Champaign County Auditor · Clark County Auditor · Clinton County Auditor · Coshocton County Auditor · Crawford County Auditor · Fairfield County Auditor · Fayette County Auditor · Franklin County Auditor · Greene County Auditor · Guernsey County Auditor · Hardin County Auditor · Highland County Auditor · Hocking County Auditor · Holmes County Auditor · Jackson County Auditor · Knox County Auditor · Licking County Auditor · Logan County Auditor · Lorain County Auditor · Madison County Auditor · Marion County Auditor · Miami County Auditor · Montgomery County Auditor · Morrow County Auditor · Muskingum County Auditor · Perry County Auditor · Pickaway County Auditor · Richland County Auditor · Ross County Auditor · Stark County Auditor · Tuscarawas County Auditor · Union County Auditor · Wyandot County Auditor · OGRIP Ohio Statewide Parcels · Athens County subdivisions, town plats and additions (Athens County Auditor GIS) · Cincinnati Community Council Boundaries · Cincinnati Statistical Neighborhood Approximations (SNA), 2020 · Clark County recorded subdivision plats · Clermont County recorded subdivision plats · Cleveland Heights neighborhoods · Cleveland Statistical Planning Areas (SPAs) / neighborhoods · Columbus Communities · Columbus Community Planning Areas · Coshocton County subdivisions (recorded plats and town additions) · Dayton neighborhoods · Dublin Civic Associations · Franklin County recorded subdivision and condominium plats · Hamilton (Ohio) 17Strong neighborhoods · Lima neighborhood associations · Logan County subdivision and condominium plats · Madison County subdivisions (recorded plats) · Morgan County subdivision, addition and town plats · Muskingum County subdivision plats · Perry County subdivisions and town additions (recorded plat names on the county engineer's parcels) · Richland County subdivisions and condominiums (recorded plats, county GIS) · Sandusky neighborhoods · Stark County recorded allotment (subdivision) and condominium plats · Toledo neighborhood associations · Union County subdivision plats
Building permits
15 to 30930 housing units permitted 2016 to 2025Springfield · 15.9 per 1,000 residents · 211 in 2025
Source: Census Bureau Building Permits Survey, annual place files 2016 to 2025: new privately owned housing units, buildings and construction value authorized by each Ohio permit office, given to each ZIP through the jurisdiction where most of its… · Census building permits
Full detail
Building permits
- Mix
- 428 single-family houses, 342 units in buildings of five or more, 160 in duplexes and small buildings
- Value
- $191.1 million of construction at the value declared on the permits
- By year
- 2016: 11, 2017: 58, 2018: 5, 2019: 16, 2020: 79, 2021: 86, 2022: 132, 2023: 150, 2024: 182, 2025: 211, 2026 through July: 48
Survey counts are permits issued, not houses finished, and cover new residential construction only: additions, remodels, garages and commercial buildings are not in the survey. Values are the applicants' estimates. Where a city runs the building department for its township neighbours, the city's figure covers them too.
Source: Census Bureau Building Permits Survey, annual place files 2016 to 2025 (new privately owned residential units authorized), for the permit-issuing jurisdiction where most of this ZIP's residents live · Census building permits
Home prices
100 to 150%+106% in ten years+70% in five · +9% in 2025
Source: FHFA House Price Index, annual five-digit ZIP all-transactions series (repeat sales and refinance appraisals of conforming-mortgage homes, developmental, not seasonally adjusted): ten-, five- and one-year changes and the level against… · FHFA house price index · Zillow research data · Realtor.com data
Full detail
Home prices
- Five years
- +70% from 2020 to 2025
- Last year
- +9% in 2025
- Since 2000
- prices stand at 1.9 times their 2000 level
- Series
- tracked since 1986
Zillow's typical home value here is $115K (2026-07), up 0% over the year, up 39% over five years and up 153% over ten. Typical asking rent $962 a month (2026-07).
On the market (Realtor.com, August 2026): median asking price $129,750 (up 1.8% in a year), $99 per square foot for a typical 1,382 sq ft listing; 17 active listings, 8 new this month; listings spend a median 33 days on the market (down 13% from a year earlier); 10% of listings have cut their price.
The index follows the same houses through repeat sales and refinance appraisals on conforming mortgages, so it measures price change rather than the price level (the Homes card has the median value). Consumer prices rose about 36% from 2015 to 2025, so a gain under 36% is a loss in real terms.
Source: Federal Housing Finance Agency House Price Index, annual five-digit ZIP all-transactions series (repeat sales and refinance appraisals of conforming-mortgage homes, developmental, not seasonally adjusted), latest release; Zillow Home Value Index (mid-tier, smoothed, seasonally adjusted) and Zillow Observed Rent Index by ZIP, Zillow Research · FHFA house price index · Zillow research data · Realtor.com data
School tax
30 to 40 mills32.1 effective school millsSpringfield City · about $2,251 a year on a $200,000 home
Source: Ohio Department of Taxation, Aggregate Property Tax Rates by School District, tax year 2025 (DTE 515), joined by IRN and weighted by each ZIP's residents in every district; school levies only; Ohio Department of Taxation The Finder rate… · Ohio tax data series · The Finder
Full detail
Local taxes
- Springfield City 74% of residents
- 32.1 effective mills (62.2 gross); $2,246 a year on a $200,000 home. Operating 13.4, bonds 2.2, improvements 3.6, substitute 6.3, inside millage 6.6.
- Clark-Shawnee Local 18% of residents
- 31.8 effective mills (43.7 gross); $2,227 a year on a $200,000 home. Operating 13.4, bonds 3.4, substitute 8.4, inside millage 6.6.
- Municipal income tax
- Springfield 2.4% (75% of residents); township residents outside a city or village pay none. Charged on wages and business profits where you work and, after credits, where you live.
- School district income tax
- Springfield City none (74% of residents), Clark-Shawnee Local none (18% of residents), Greenon Local none (6% of residents). About a third of Ohio districts levy one.
- Sales tax
- 7.25% combined rate in Clark County: Ohio's 5.75% plus county and transit levies.
A mill is $1 per $1,000 of taxable value, and taxable value is 35% of market value. Effective rates fall as values rise because Ohio holds most voted levies to the dollars first approved. County, municipal or township, library, park and vocational-school levies are added on the same bill and are not counted here.
Source: Ohio Department of Taxation, Aggregate Property Tax Rates by School District, tax year 2025 (composite DTE 515); weighted by the share of this ZIP's residents in each district; The Finder rate tables for municipal, school district and sales taxes, September 2026 · Ohio tax data series · The Finder
Utilities and getting around
The companies and networks that keep a house running and a resident moving: electric, gas, phone and internet service, and the roads, transit, rail and airports around it.
Electric
Ohio EdisonOhio EdisonInvestor-owned utility
Source: PUCO certified electric territories via ODOT plus HIFLD municipal systems (EIA-861) with ODOT corporate limits; EIA-861 reliability (outages), sales to ultimate customers (residential prices and bills), net metering and advanced meters by… · PUCO electricity · ODOT territories service · EIA-861 · DOE LEAD Tool · HIFLD retail service territories
Full detail
Who delivers the electricity
- Ohio Edison investor-owned100% of residentsFirstEnergy Corp.
Ohio Edison outages, 2024: the average customer lost power for 234 minutes (114 minutes leaving out major storm days), about 1.3 interruptions a year.
Ohio Edison standard service offer price, 2024: 16.18 cents per kWh, about $127 a month for the average home, for the 251,751 residential customers who have not chosen a supplier; the other 706,029 pay Ohio Edison 7.3 cents per kWh for delivery plus their supplier's price (EIA-861).
Ohio Edison solar and meters, 2024: 3,963 customers run net-metered solar (67.8 MW, 3,791 of them homes); 26% of its 1,094,550 meters are two-way smart (AMI) meters, 8% drive-by automated reads (EIA-861).
Energy burden: households here spend an average 3.9% of income on electricity, gas and other fuels (about $2,241 a year against $58,148 of income); the 54% of households below 80% of the area median income spend 8.6%, and 38% of households fall in groups averaging 6% or more, the usual line for a high burden (DOE LEAD Tool, 2022 update, built from 2018 to 2022 survey data).
Source: PUCO certified territories via ODOT · HIFLD retail service territories (EIA Form 861) · 2020 census blocks · outage statistics from EIA-861 Reliability, 2024 with 2023 where a utility skipped a year (SAIDI and SAIFI, IEEE 1366) · residential prices from EIA-861 Sales to Ultimate Customers, net metering and advanced meters from the EIA-861 files of the same years · DOE LEAD Tool 2022 household energy burden by tract, apportioned into ZIPs by block population · PUCO electricity · ODOT territories service · EIA-861 · DOE LEAD Tool · HIFLD retail service territories
Gas
Columbia Gas of OhioColumbia Gas of OhioPUCO-regulated utility · 85% of homes heat with utility gas
Source: PUCO 2026 county map of gas distribution companies, HIFLD/EIA-176 territory polygons, ACS 2020-2024 heating fuel · PUCO natural gas · HIFLD
Full detail
Natural gas here
85% of the 5,729 homes here heat with utility gas.
Utility gas 85%Electricity 10%Propane or LP 3%Oil, wood, other 2%
- Columbia Gas of Ohio regulated utility100% of residents, main companyNiSource Inc.
Pipes under the street: Columbia Gas of Ohio reported 20,620 miles of distribution main to PHMSA for 2025, 64% plastic and 6.6% cast iron or bare steel (the leak-prone materials); 3,271 hazardous leaks repaired in 2025.
PUCO lists 2 companies operating in Clark County: CenterPoint Energy Ohio, Columbia Gas of Ohio.
Source: PUCO gas distribution companies by county, April 2026 · federal (EIA) territory polygons, 2016 · Census ACS 2020 to 2024 heating fuel · PUCO natural gas · HIFLD
Power plants
20 to 35 milesMadison Fields Solar Project, LLC · 23.2 misolar, 180 MW · 1 plant within 10 miles
Source: EIA-860 power plant inventory via HIFLD (202 Ohio plants, February 2025): nearest plant, nearest plant of 100 MW or more, plants and capacity by fuel within 10 miles; USGS U.S. Wind Turbine Database (June 2026) and U.S. Large-Scale Solar… · EIA-860 · HIFLD · USGS wind turbines · USGS solar · NRC emergency planning zones
Full detail
Power plants
Nearest plant of any size: Springfield Solar LLC, 1.6 mi (solar, 2 MW).
1 plant within 10 miles totalling 2 MW: 1 solar (2 MW).
Solar: Springfield Solar, LLC, 2 MW AC (2012), 7 acres, 1.6 mi away; 2 utility-scale solar farms within 15 miles.
Capacity is net summer capacity in megawatts (EIA), not output; a solar farm's 200 MW runs a quarter of the hours a gas plant's would. Small peaking engines and landfill-gas units count as plants.
Source: U.S. Energy Information Administration Form 860 plant inventory via HIFLD (February 2025); USGS U.S. Wind Turbine Database and U.S. Large-Scale Solar Photovoltaic Database; NRC emergency planning zones around Perry and Davis-Besse (residents inside the roughly 10-mile zone counted by 2020 census block); straight-line miles from the ZIP's population-weighted center · EIA-860 · HIFLD · USGS wind turbines · USGS solar · NRC emergency planning zones
Pipelines
1 to 3 milesNearest transmission line 1.8 miColumbia Gas Trans Co (interstate) · 2.6 mi of pipe in the ZIP
Source: EIA natural gas interstate and intrastate transmission pipelines via Esri's Federal User Community copy on ArcGIS Online (data last updated July 2025; 1,239 segments in and around Ohio): miles inside each ZIP by operator, distance from the… · EIA U.S. Energy Atlas · ArcGIS Online item
Full detail
Gas transmission pipelines
2.6 miles of transmission pipe cross this ZIP: Columbia Gas Trans Co 2.6 mi.
Transmission lines run at hundreds of pounds of pressure and are inspected under federal rules; the distribution mains that actually feed homes are a separate, denser network not shown here. By mileage in this EIA layer Ohio's map is dominated by Columbia Gas Transmission and East Ohio Gas's intrastate lines; Texas Eastern and the Rover and Nexus lines built for Utica shale gas are among the other large interstate systems.
Source: U.S. Energy Information Administration Natural Gas Interstate and Intrastate Pipelines layer (data last updated July 2025, pulled September 2026), via the ArcGIS Online copy maintained by Esri's Federal User Community; straight-line miles from the ZIP's population-weighted center; lengths clipped to the ZIP boundary in an equal-area projection · EIA U.S. Energy Atlas · ArcGIS Online item
Phone
AT&T OhioAT&T OhioIncumbent telephone company
Source: PUCO Telecom map service, layer 7 ILEC Company Service Area (incumbent local exchange carriers, fetched 2026-09-08) by resident share of 2020 census blocks · PUCO telephone
Full detail
Incumbent telephone company
- AT&T Ohio100% of residentsIncumbent local exchange carrier
Source: PUCO incumbent local exchange carrier service areas · 2020 census blocks · PUCO telephone
Internet
Under 2% lack 100/20 service100% can get 100/20 Mbpsfiber 14% · cable 99% · 6,130 locations
Source: FCC Broadband Data Collection, June 2024, fixed availability by H3 hexagon (Esri Living Atlas, Ohio subset); Census ACS 2020-2024 table B28002 internet subscriptions; Ookla Open Data fixed speed tests 2025 Q2 by tile, averaged inside the… · FCC broadband map · Ookla open data · Census ACS
Full detail
Internet
Served, 100/20 Mbps or better 100%Underserved, 25/3 to 100/20 0%Unserved, under 25/3 0%
Fiber reaches 14% of locations, cable 99%; a year earlier 100% were served.
Of 5,729 households, 75% subscribe to cable, fiber or DSL, 13% rely on a cellular plan only, and 8% have no internet at home.
Measured by Ookla speed tests, April to June 2025: typical fixed download 359.3 Mbps, upload 28.7 Mbps, 26 ms latency, across 215 tests from up to 83 devices in 49 map tiles.
Source: FCC Broadband Data Collection, June 2024 (availability) · Census ACS 2020 to 2024 (subscriptions) · Ookla Open Data, fixed-network speed tests by tile, 2025 Q2 (measured speeds) · FCC broadband map · Ookla open data · Census ACS
Cell signal
5G nearly everywhere5G on 100% of the land4G or better 100% · AT&T 100% · T-Mobile 100% · Verizon 100%
Source: FCC Mobile Broadband Data Collection, carrier-reported 4G LTE and 5G coverage by H3 hexagon (Esri Living Atlas layer last updated 24 November 2025, June 30, 2025 filing round), fetched 2026-09-08; FCC Antenna Structure Registration… · FCC broadband map · FCC antenna registration · Ookla open data
Full detail
Cell signal
- AT&T4G 100% · 5G 100%
- T-Mobile4G 100% · 5G 100%
- Verizon4G 100% · 5G 66%
Registered towers: 4 antenna structures registered with the FCC inside this ZIP and 13 within 3 miles of its center; the tallest inside is a 471-foot tower. Only structures over 200 feet or near airports must register, so most cell sites on short poles, water towers and rooftops are not counted.
Measured mobile speeds (Ookla speed tests, April to June 2026): typical download 230.3 Mbps, upload 12.5 Mbps, latency 40 ms over 29 tests from up to 12 devices in 10 map tiles.
Coverage as the carriers report it to the FCC for outdoor use at a stationary spot, by land area rather than by residents; indoor signal and rural hollows can be worse.
Source: FCC Mobile Broadband Data Collection via Esri Living Atlas (layer last updated November 2025, i.e. the June 30, 2025 filing round), carrier-reported outdoor coverage by hexagon, summed over the ZIP's land; FCC Antenna Structure Registration database, September 2026; Ookla open data mobile tiles, 2026 Q2 · FCC broadband map · FCC antenna registration · Ookla open data
EV chargers
2 to 5 milesFast charger 2.4 mi: JEFF WYLER POWER LINK0 public stations in the ZIP (0 Level 2, 0 DC fast ports) · 2 within 5 miles of its center
Source: NREL Alternative Fuels Data Center station list as of May 29, 2026 (USDOT BTS copy: 2,136 Ohio electric stations, of which the 1,850 public and open are used, NREL restricted-access records such as dealer-service and hotel-guest chargers… · Alternative Fuels Data Center · BTS Alternative Fueling Stations (NTAD)
Full detail
EV charging
No public station inside this ZIP; the nearest of any kind is JEFF WYLER POWER LINK, 2.4 mi. 2 stations within 5 miles of the ZIP's population center, 2 with DC fast charging.
Level 2 adds roughly 20 to 30 miles of range an hour; DC fast charging fills most cars in under an hour. Listings are operator-reported and lag new openings and closures.
Source: NREL Alternative Fuels Data Center via the U.S. DOT Bureau of Transportation Statistics (public, open electric stations, the posts at one site merged, restricted-access sites excluded), and chargers in neighbouring states near the border; straight-line miles from the ZIP's population-weighted center; station list as of May 29, 2026 · Alternative Fuels Data Center · BTS Alternative Fueling Stations (NTAD)
Transit
75% or more live within half a mile of a stop78% within half a mile of a stop17 stops in the ZIP · Springfield City Area Transit
Source: USDOT BTS National Transit Map stops (National Transportation Atlas Database, 2025 vintage, fetched September 2026), plus the Springfield, Lancaster-Fairfield, Knox County Transit, WayGo and BGSU Shuttle GTFS feeds: share of residents… · BTS National Transit Map · BTS transportation atlas · Springfield City Area Transit GTFS feed · Lancaster-Fairfield Public Transit GTFS feed · Knox County Transit GTFS feed · WayGo GTFS feed · BGSU Shuttle GTFS feed
Full detail
Public transit
17 stops inside this ZIP: Springfield City Area Transit (17).
Only fixed-route systems that publish a GTFS feed appear; dial-a-ride and demand-response services do not, and a handful of small fixed-route systems publish no feed at all. Half a mile is roughly a ten-minute walk.
Source: USDOT Bureau of Transportation Statistics, National Transit Map stops (National Transportation Atlas Database, 2025 vintage, fetched September 2026), plus the Springfield, Lancaster-Fairfield, Knox County Transit, WayGo and BGSU Shuttle GTFS feeds; share of 2020 census block population within half a mile of a stop · BTS National Transit Map · BTS transportation atlas · Springfield City Area Transit GTFS feed · Lancaster-Fairfield Public Transit GTFS feed · Knox County Transit GTFS feed · WayGo GTFS feed · BGSU Shuttle GTFS feed
Walkability
Below average (5.76 to 10.5)Walkability 7.2 of 2085 intersections per square mile · no EPA transit data
Source: EPA National Walkability Index (Smart Location Database 3.0, 2021) by block group, population-weighted to ZIPs through 2020 census block points · EPA walkability index · Smart Location Database · Census ACS
Full detail
Walkability
- Street grid
- 85 intersections per square mile, a mix of grid and cul-de-sacs
- Transit
- the EPA's 2020 transit file lacks this area's bus system, so it puts nobody here within three-quarters of a mile of a stop; the Transit card finds 78% of residents within half a mile of one
- Mix of uses
- employment mix 0.37 and mix of homes and job types 0.54 on the EPA's 0 to 1 scales, where 1 is the most varied
- Car-free households
- 15.2% of households have no vehicle (Census ACS 2020 to 2024)
The index scores every block group on intersection density, distance to transit and how mixed its jobs and homes are, then ranks them against the whole country. It measures the street pattern, not sidewalks, safety or hills. Here the transit third of the score sits at its minimum because the EPA held no feed for this area's buses; counting them would likely add several points to the score and could move this ZIP up a band.
Source: EPA National Walkability Index (Smart Location Database 3.0, 2021) by census block group, population-weighted to the ZIP through 2020 census blocks; car-free households from Census ACS 2020 to 2024 table B25044 (the Homes card), or, where that is missing, the Smart Location Database's own 2014 to 2018 share weighted by households · EPA walkability index · Smart Location Database · Census ACS
Rail crossings
11 to 2512 public crossings11 gated · up to 16 trains a day · Norfolk Southern
Source: FRA Grade Crossing Inventory (current records, Ohio): open at-grade crossings inside each ZIP, gates, trains a day at the busiest, timetable speed, railroads; nearest crossing to the population-weighted center; FRA highway-rail grade… · FRA crossing inventory (Form 71, current) · FRA crossing incidents (Form 57) · FRA rail equipment accidents (Form 54) · FRA safety data · DOT open data
Full detail
Rail crossings
11 with gates; railroads: Norfolk Southern (9), Indiana & Ohio Railway (3). Busiest crossing: 16 trains a day reported; fastest line 50 mph.
Collisions: 7 crossing incidents reported to the FRA inside this ZIP since 2010 (3 injured), the latest in 2024; most at W High Street in Springfield (1).
Train accidents: 1 rail equipment accident inside this ZIP since 2010 (1 derailment); $1.9 million in damage. Latest: 2022, derailment (Norfolk Southern Railway Company); the most common cause here is other track geometry defects.
Clark County has logged 11 rail accidents since 2010, 11 of them derailments (FRA Form 54). Yard mishaps at walking speed dominate; main-line derailments are the rare, dangerous ones.
Train counts and speeds are the railroad's last inventory update. Crossings with only crossbucks rely on the driver; Ohio has averaged about 77 crossing collisions a year from 2010 to 2025 (FRA Form 57), between 64 and 87 in a year.
Source: Federal Railroad Administration, Grade Crossing Inventory (Form 71, current records); crossings whose point falls inside the ZIP boundary, closed crossings excluded; nearest crossing measured from the population-weighted center. Collisions are FRA Form 57 crossing incidents since 2010, placed by crossing id through the inventory's coordinates; train accidents are FRA Form 54 rail equipment accidents since 2010, placed by their own reported coordinates, counted one per incident rather than one per report (county totals from the same file). All three pulled from data.transportation.gov, September 2026 · FRA crossing inventory (Form 71, current) · FRA crossing incidents (Form 57) · FRA rail equipment accidents (Form 54) · FRA safety data · DOT open data
Bridges
No bridge rated poor27 bridges, 0 rated poortypical build year 1968 · busiest IR-70, 63,108 vehicles a day
Source: FHWA National Bridge Inventory 2025 (26,713 Ohio structures): bridges inside each ZIP, poor-condition ratings, ages, traffic · FHWA bridge inventory · ODOT TIMS bridge inventory (live)
Full detail
Bridges
- Age
- typical bridge built 1968, 3 built before 1950; oldest 1900, Count Rd No 318 over Rebert Pk O Br Mill Crk
- Busiest
- IR-70 over CR 338 Xenia Rd Aband. R, 63,108 vehicles a day (2019 count)
- Owners
- state 15, county 10
Ratings come from the inspection every bridge gets at least every two years; poor means deterioration that needs repair, not imminent danger. FHWA's file is a yearly snapshot with inspections through early 2025, so a bridge replaced, re-rated or closed since then still shows its old rating here; ODOT's TIMS bridge inventory carries the current one. Traffic figures are the average daily counts the bridge owners filed with the inventory; most Ohio counts date from 2015 and some are older. County engineers own most of Ohio's small bridges and ODOT the big ones.
Source: Federal Highway Administration, National Bridge Inventory 2025 (Ohio file); structures whose point falls inside the ZIP boundary; condition from NBI items 58, 59, 60 and 62 (deck, superstructure, substructure, culvert) · FHWA bridge inventory · ODOT TIMS bridge inventory (live)
Traffic
50,000 to 100,00065,551 vehicles a day on I-7017,766 trucks · 382K vehicle-miles a day inside the ZIP
Source: ODOT traffic count segments (2025 annual average daily traffic by road segment, ODOT Transportation Information Mapping System): segments assigned to the ZIP holding their midpoint; NHTSA Fatality Analysis Reporting System 2020 to 2024… · ODOT TIMS traffic count segments · NHTSA FARS
Full detail
Traffic
- Trucks
- 17,766 a day on I-70, 27% of its traffic
- Driving
- about 382K vehicle-miles a day on the 286 counted segments inside the ZIP; the typical segment carries 2,586 vehicles
- Freeway volumes
- 3 segments carry 50,000 or more a day
- Busiest local road
- county road 338, 10,740 vehicles a day
Annual average daily traffic is both directions combined, averaged over the year. County, township and city roads are labelled by their route number, which ODOT uses instead of the street name. Most city streets have no count, so the busiest local road is the busiest counted one. Interchange ramps are left out of the busiest-road pick; a ZIP with nothing but ramps shows one labelled ramp and its ODOT number.
Road deaths: 10 people died in 10 crashes inside this ZIP in 2020 to 2024 (4 pedestrians, 1 cyclist, 1 motorcyclist); 0 involved a drinking driver and 6 happened in the dark; most on CR-338 YELLOW SPRINGS ST (2). That is 15.0 deaths a year per 100,000 residents against 10.6 across Ohio's ZIPs; deaths are counted where the crash happened, and many who die live elsewhere. (NHTSA FARS)
Source: ODOT traffic count segments, 2025 annual average daily traffic (ODOT TIMS); segments assigned to the ZIP holding their midpoint; NHTSA Fatality Analysis Reporting System 2020 to 2024, crashes placed by their coordinates · ODOT TIMS traffic count segments · NHTSA FARS
Airports and Amtrak
15 to 30 milesDAY · 20.7 miJames M Cox Dayton International · Amtrak at Cincinnati 66.8 mi
Source: FAA airport facilities and Amtrak stations via USDOT BTS: nearest airport with scheduled airline service (Part 139 class I), nearest public-use airport, nearest Amtrak station, including out-of-state ones near the border · BTS transportation atlas
Full detail
Airports and trains
- Nearest airfield
- Springfield / Beckley Municipal (SGH), Springfield, 4.7 mi, public use
- Amtrak
- Cincinnati station, 66.8 mi
Ohio's Amtrak stops are on the Floridian (Amtrak has temporarily combined the Capitol Limited with the Silver Star), the Lake Shore Limited and the Cardinal, all overnight trains; Cincinnati's only calls three times a week. Amtrak's Thruway bus stops, Dayton-Trotwood among them, are not counted as stations here. Airline service at Toledo and Rickenbacker is limited to a few routes; Youngstown-Warren has had no airline flights since 2018.
Source: FAA airport facilities and Amtrak stations via USDOT BTS National Transportation Atlas; straight-line miles from the ZIP's population-weighted center · BTS transportation atlas
Land, air and risk
The ground itself and what can go wrong on it: radon, flood risk, air quality, old mines and wells, and the parks, wetlands and open land still left.
Radon
4 to 8 pCi/L5.4 pCi/L average radon125 tests · 48% above 4 pCi/L · median 3.9
Source: Ohio Department of Health radon test results by ZIP code since 2010 (pre-mitigation), ZIPs with five or more tests · ODH radon program
Full detail
Radon in this ZIP
48% of tests at or above EPA's 4 pCi/L action level · median 3.9 · highest 24.2
A ZIP average says nothing about one house; readings next door can differ tenfold. Test yours, and fix it at 4 pCi/L or more.
Source: odh.ohio.gov radon levels by ZIP code, tests since 2010, before mitigation · ODH radon program
Flood
Under 2% of residents1.3% of residents in the 1% floodplain15% of the land is floodplain, 1% more in the 0.2% zone · zone A
Source: FEMA National Flood Hazard Layer, flood hazard zones, fetched 2026-09-08; OpenFEMA NFIP redacted claims for Ohio (frozen June 2026), by reported ZIP; USGS NWIS annual peak flows for the nearest active stream gauge; NOAA Atlas 14… · FEMA flood hazard layer · FEMA Map Service Center · OpenFEMA · NOAA Atlas 14 · USGS stream gauges
Full detail
Flood zones
15% of the ZIP's land is in that floodplain, and another 0.9% is in the 0.2% (500-year) zone. Zones mapped here: A, AE.
Design storms (NOAA Atlas 14): a 100-year storm here drops 5.4 inches in 24 hours (2.8 in a single hour, 4.2 in six); a 2-year storm 2.7, 10-year 3.8, 25-year 4.4, 500-year 6.6 inches in 24 hours. Storm sewers, culverts and detention ponds are sized from these numbers, and a "100-year" storm has a 1% chance every year.
Nearest river gauge: Mad River near Springfield OH, 2.6 mi away, draining 490 square miles. Record flow 55,400 cubic feet a second at a stage of 16.9 ft on 1913-03-25; the highest since 2016 was 13,300 on 2018-04-03 (USGS, 105 annual peaks, 1904 to 2025).
10 federal flood insurance policies are in force in this ZIP, covering $1.5 million of buildings; 80% of them are in a mapped high-risk zone; the typical policy costs $1,298 a year (about 1% of households).
14 federal flood insurance claims from this ZIP since 1978, 1 since 2010, paying about $101,279 in all; the worst year was 2005 with 4 claims; 0% of claims came from outside the mapped high-risk zone.
Community status: Springfield takes part in the National Flood Insurance Program; flood map effective 02/17/10. Clark County's unincorporated areas take part in the National Flood Insurance Program; flood map effective 02/17/10.
Lenders require flood insurance on mortgaged homes in the 1% zone (zones A and AE). Block centers understate narrow floodplains in rural areas, so check the FEMA map for a specific address.
Source: FEMA National Flood Hazard Layer (effective flood insurance rate maps, levee centerlines) · 2020 census block centers · ZIP land area by polygon overlay, open water excluded; NOAA Atlas 14 precipitation frequency at the ZIP center; USGS NWIS annual peak flows; OpenFEMA NFIP policies in force by reported ZIP as of September 2026, NFIP redacted claims and the Community Status Book · FEMA flood hazard layer · FEMA Map Service Center · OpenFEMA · NOAA Atlas 14 · USGS stream gauges
Hazard risk
Under 20 (lowest fifth of US tracts)Risk score 15 · higher than about 15% of US tractsIce storm 72 · Hail 64
Source: FEMA National Risk Index, census tracts, December 2025 release, population-weighted to ZIPs · FEMA National Risk Index · NRI census tract layer (ArcGIS)
Full detail
Natural hazard risk
- Ice storm72
- Hail64
FEMA's expected annual loss here from all hazards: $2.7 million a year in buildings, crops and lives.
The index blends how often a hazard strikes, what it would cost, and how vulnerable and resilient the community is. Inland flooding (rivers and heavy rain) scores 25, tornado 53, winter weather 59.
Source: FEMA National Risk Index, census tracts, December 2025 release, weighted to this ZIP by 2020 block population · FEMA National Risk Index · NRI census tract layer (ArcGIS)
Climate
Under 20 inches of snow a year19" of snow a year · 51.2°F averageJanuary low 19° · July high 84° · 40" of precipitation
Source: NOAA NCEI 1991-2020 U.S. Climate Normals, annual and monthly, 261 Ohio stations; each ZIP takes the nearest station reporting each element from its population-weighted center; U.S. Drought Monitor weekly county statistics 2000 to 2026… · NOAA climate normals · NOAA climate at a glance · U.S. Drought Monitor
Full detail
Climate
- Temperature
- 51.2°F average; typical January low 19°, July high 84°
- Hot and cold days
- 12 days a year reach 90°F; 126 nights fall below freezing, 5 below 0°F; 33 days never climb above freezing
- Rain and snow
- 40.3 inches of precipitation on 79 days with a tenth of an inch or more; 19 inches of snow on 8 days with an inch or more, snow on the ground 31 days
- Degree days
- 5,808 heating, 802 cooling (base 65°F): the higher the heating number, the bigger the winter gas bill
Drought (U.S. Drought Monitor): since 2020 Clark County has spent 39 weeks in moderate drought or worse, 4 of them severe or worse (most recently 4 weeks in 2024), and 79 weeks at least abnormally dry. The worst since 2000 was extreme drought in 2024/09; 7% of all weeks since 2000 were in drought. As of 2026-09-01: no drought.
Long run (NOAA, Clark County): the average year ran 52.3 °F over 1996 to 2025 against 50.4 °F over 1901 to 1930, 1.9 °F warmer (1.7 °F warmer than 1951 to 1980); the warmest year on record was 2024 at 55.7 °F, and 2025 came in at 52.6 °F. Precipitation averaged 43.2 inches a year lately against 39.0 a century ago, 11% more; the wettest year was 2011 with 58.3 inches, and 2025 brought 42.7. More rain in bigger bursts is what strains storm sewers and septic fields.
Stations: Springfield WTP (4.7 mi, temperature and precipitation); New Carlisle (10.9 mi, snowfall; 13 years of snowfall record). Normals are thirty-year averages, so a single winter can run far above or below them; NOAA marks this snowfall normal provisional because the station record is too short or too patchy for a standard normal, and the temperature and precipitation figures here skip stations with under 10 years.
Source: NOAA National Centers for Environmental Information, U.S. Climate Normals 1991-2020 (annual/seasonal and monthly); nearest reporting station to the ZIP's population-weighted center for each element; U.S. Drought Monitor county statistics · NOAA climate normals · NOAA climate at a glance · U.S. Drought Monitor
Air
8.5 to 9PM2.5 8.7 µg/m³ at Springfield Fire St1, 1.8 miozone 66 ppb at Springfield Well Fd · Clark County median AQI 45
Source: EPA Air Quality System 2025 annual summaries: nearest PM2.5 and ozone monitors from each ZIP's population-weighted center, county AQI day counts; EPA ECHO Clean Air Act permitted sources in Ohio (air_rest_services, September 2026); EPA… · EPA air data files · EPA AirToxScreen · EPA Green Book · EPA ECHO
Full detail
Air quality
- Worst days
- 98th-percentile day 17.7 µg/m³ (24-hour standard 35)
- Ozone
- 66 ppb, 4th-highest daily 8-hour reading at Springfield Well Fd, 6.6 mi away (standard 70)
- Clark County AQI, 2025
- 223 good days, 138 moderate, 2 unhealthy for sensitive groups or worse of the 363 days indexed; peak 126, median 45
- Clark County AQI, 2026 so far
- 76 good days, 39 moderate and 0 unhealthy for sensitive groups or worse in the 115 days indexed through April 30; peak 90 (Ozone)
- Air toxics
- 30 in a million lifetime cancer risk from outdoor air toxics across Clark County (EPA AirToxScreen 2020), mostly formaldehyde (17) and carbon tetrachloride (3)
- Permitted sources
- 9 permitted air sources inside this ZIP under the Clean Air Act, 1 synthetic minor; 1 had a violation in the last 3 years. Notable: A&B Asphalt (1 violation quarter). Nearest major source Fairborn Cement Company LLC in Xenia, 11.8 mi (7 permanently closed sources also on file) (EPA ECHO)
- Air standards
- Clark County is a maintenance area for fine particulate (1997) (Dayton-Springfield, OH, redesignated 2013), meaning it once failed that standard and must keep a plan to stay clean (EPA Green Book)
Ohio has 38 PM2.5 monitors, mostly in cities and near industry, so a rural ZIP borrows a reading from far away. 2025 includes Canadian wildfire smoke days. Air-toxics risk is EPA's modelled lifetime estimate for the county as a whole; EPA's national average is about 30 in a million, and formaldehyde, with the globally mixed carbon tetrachloride background and acetaldehyde, makes up most of it.
Source: EPA Air Quality System, 2025 annual summary files (monitor annual concentrations, county AQI) and the 2026 daily county AQI file; straight-line miles from the ZIP's population-weighted center to the nearest monitor · EPA air data files · EPA AirToxScreen · EPA Green Book · EPA ECHO
Toxic sites
3 to 8 milesNearest NPL site 6.4 mi: Donnelsville Contaminated Aquifer4 toxic-release reporters · 0 Superfund program sites in the ZIP
Source: EPA Facility Registry Service: Superfund NPL and SEMS sites, Toxics Release Inventory reporters (EPA geoplatform), fetched 2026-09-08; the nearest NPL site also considers sites in PA, WV, KY, IN and MI within about 20 miles of the border… · EPA Facility Registry · EPA Superfund sites · Ohio EPA cleanup sites · EPA UST Finder · EPA ECHO
Full detail
Toxic and Superfund sites
4 facilities have reported toxic chemical releases or transfers to EPA's inventory from inside this ZIP, and 0 sites appear in the Superfund program's list (most assessed and never listed).
113 EPA-registered facilities of all kinds in this ZIP: 3 brownfield sites in the cleanup program (Castle Knoll Building, First Christian Church, Former Cromwell-Collier Publishing and Parking Lot), 49 hazardous-waste handlers, 17 with air permits, 6 with water discharge permits.
Nearest landfill: Springfield Landfill, 1.4 mi from the center, municipal solid waste landfill; 3 landfill sites within 3 miles of the population center, 2 inside this ZIP. Ohio EPA's list includes closed and historic dumps.
State cleanup program: 8 sites inside this ZIP (Clearview MHP Well Field Unknown Source; Dayton Rd Landfill; Denune Whse and more), 23 within 3 miles of the population center; the nearest is ITT Jabsco Property, 0.6 mi from the center, voluntary cleanup (VAP).
Voluntary cleanups: 3 properties inside this ZIP hold an Ohio EPA covenant not to sue after a Voluntary Action Program cleanup; 9 such properties within 3 miles of the population center, nearest Greater Euclid Elements Area Property, 0.6 mi. These are former industrial and commercial sites certified clean enough to reuse.
Solid waste: 3 licensed waste facilities inside this ZIP (3 compost sites); nearest Springfield WWTP (compost site), 1 mi from the center; 5 within 5 miles of the center (Ohio EPA licences, 2026). Compost sites and transfer stations are where most of a county's trash and yard waste actually goes.
Hazardous waste (EPA ECHO): 18 active RCRA handlers inside this ZIP; 2 had a violation in the last 3 years. Notable: Electric Eel (2 violation quarters); US Xpress (1 violation quarter). Nearest treatment, storage or disposal facility: Department of the Air Force Base Area B in Wright-Patterson Afb, 12.5 mi. Handlers include every business that generates hazardous waste, from body shops to chemical plants.
Underground tanks: 8 sites with 19 registered underground storage tanks in use (54 more tanks closed over the years); 44 leaking-tank releases on record, 4 open at the time, 44 inside a drinking-water source protection area; 3 reported since 2015, the latest in 2018 (EPA UST Finder, Ohio records as of 2018-2019).
Drop-off sites: the nearest scrap tire drop-off is Clark County Waste Management, Springfield, 1.4 mi away (5 within 15 mi); the nearest household battery drop-off is Lowe's, Springfield, 2.6 mi away (2 within 15 mi) (Ohio EPA).
The inventory covers larger manufacturers and federal facilities that use listed chemicals; reporting means use or release, not a measured hazard to neighbours. Superfund status: on, proposed for, or deleted from the list after cleanup.
Source: EPA Facility Registry Service, Superfund (SEMS and NPL) sites and Toxics Release Inventory reporters, points inside the ZIP boundary; distance from the ZIP's population-weighted center · EPA Facility Registry · EPA Superfund sites · Ohio EPA cleanup sites · EPA UST Finder · EPA ECHO
Toxic releases
No dataNo TRI-reporting facility
Source: EPA Toxics Release Inventory basic data files, Ohio, reporting years 2020 to 2024 (2024 shown, 2020 for the trend); facilities placed in the ZCTA holding their coordinates; dioxin rows reported in grams left out of pound totals · EPA TRI data files
Full detail
Toxic releases
No facility inside this ZIP files a Toxics Release Inventory report. Only plants in listed industries with 10 or more workers that handle a listed chemical above its threshold must file, so small shops and most businesses never appear.
Source: EPA Toxics Release Inventory, basic data files for Ohio, reporting years 2020 to 2024 (2024 shown); facilities placed by their coordinates; dioxin rows reported in grams are left out of the pound totals · EPA TRI data files
Dams
1 or 22 high-hazard dams within 10 milesNearest: Clarence J. Brown Dam, 5.3 mi, condition not available
Source: U.S. Army Corps of Engineers National Inventory of Dams (1,376 Ohio dams, August 2026; 26 Corps levees and dikes counted with their parent dam): high-hazard dams near each ZIP's population-weighted center, with the state's condition… · National Inventory of Dams
Full detail
Dams
Nearest high-hazard dam: Clarence J. Brown Dam, 5.3 mi, condition not available (flood risk reduction, 98 ft high, 64K acre-feet, built 1973, on Buck Creek, federal owned).
Inside this ZIP: 1 dam, 0 high-hazard, 0 rated poor: Hosterman Lake Dam (low hazard, condition fair).
"High hazard" describes what a failure would do downstream, not the dam's shape; Ohio rates more than a third of its inventoried dams in poor condition, mostly small private lake dams. Emergency action plans are required for high-hazard dams.
Source: U.S. Army Corps of Engineers, National Inventory of Dams (August 2026 release); straight-line miles from the ZIP's population-weighted center. Condition assessments come from Ohio's dam safety program. · National Inventory of Dams
Disasters
6 to 107 tornado tracks within 5 miles since 19501 rated F2/EF2+ · 14 federal declarations for Clark County · 0 quakes M2+ within 25 mi
Source: NOAA Storm Prediction Center tornado database 1950-2025 (tracks within 5 miles of each ZIP's population-weighted center), OpenFEMA disaster declarations by county since 1956, USGS earthquake catalog M2+ since 1970 within 25 miles; NOAA… · NOAA SPC tornado data · OpenFEMA · USGS earthquakes · NOAA storm events · IEM warning archive
Full detail
Disasters on record
Strongest nearby: EF2 on 2024-02-28, 21.11 mi track (3 injured).
14 federal declarations for Clark County since Ohio's first in 1956 (9 major disasters): severe storm 5, flood 2, biological 2. Latest: Covid-19 Pandemic (2020).
0 earthquakes of magnitude 2 or more within 25 miles since 1970.
Warnings since 2015 (National Weather Service, Clark County): 27 tornado warnings (2015: 1, 2017: 3, 2018: 2, 2019: 8, 2020: 1, 2022: 3, 2023: 4, 2024: 2, 2025: 1, 2026: 2), 190 severe thunderstorm warnings, 14 flash flood warnings, 32 flood warnings and 113 flood advisories, 11 winter storm or blizzard warnings, 28 heat warnings or advisories, 8 extreme cold or wind chill warnings, 4 snow squall warnings; 1,004 products in all.
Mitigation grants (FEMA): 5 hazard mitigation projects in Clark County since 2003, worth $359,817 ($292,727 federal), covering 3 properties; mostly mitigation planning, property buyouts, advanced assistance. Largest: property buyouts for Clark (County), $158,443 (fiscal 2012).
Mitigated properties: FEMA money has treated 1 property in this ZIP in 2011: 1 safe room built. Buyouts turn repeatedly flooded lots into permanent open space.
Disaster aid to households: 30 households in this ZIP registered with FEMA after 2 declared disasters; 15 were approved for $48,378 of housing and other-needs help. Registrations by event: severe winter storms, flooding and mudslides (2005): 20; COVID-19 pandemic (2020): 10.
157 severe weather reports for Clark County since 2016 in NOAA's Storm Events log: 87 damaging thunderstorm wind, 29 river and street flooding, 15 hail, 15 tornadoes. Largest hail 2 in (Feb 28, 2024); strongest measured gust 70 mph (Jun 27, 2019); 3 injuries; about $3.0 million in reported damage, the costliest being tornadoes on Feb 28, 2024 ($1.0M). Zone-wide advisories add 47 winter weather, 8 high wind, 7 winter storms.
Tornado tracks are straight lines from touchdown to lift-off; a near miss counts, a direct hit is not distinguished. Declarations include the 2020 COVID-19 emergency for every county; the latest, declared 2 May 2024 (DR-4777), covers the 14 March 2024 tornadoes in eleven counties, Indian Lake among them.
Source: NOAA Storm Prediction Center tornado database 1950-2025; OpenFEMA disaster declarations summaries; USGS earthquake catalog (M2+, 1970 to date); NOAA Storm Events database 2016 to 2026 by county. Distances from the ZIP's population-weighted center. · NOAA SPC tornado data · OpenFEMA · USGS earthquakes · NOAA storm events · IEM warning archive
Spills
5 to 148 spills reported since 2021mostly diesel and fuel oil · 1 reached water
Source: Ohio EPA emergency response spill reports (geo.epa.ohio.gov EmergResponse/Spills2_OpenData): cases with a location inside each ZIP, 2021 to date · Ohio EPA spills data · Ohio EPA Office of Emergency Response
Full detail
Spills and releases
- What spilled
- diesel and fuel oil (2), natural gas (1), oils and hydraulic fluid (1)
- Largest
- about 200 gallons of fuel diesel / diesel fuel (vehicle on or off road) in 2021, Springfield Twp
- Reached water
- 1 of them reached a creek, river, ditch or storm drain (named or unnamed)
- By year
- 2021: 2, 2022: 1, 2023: 2, 2024: 2, 2025: 0, 2026: 1
Anyone who spills more than a reportable quantity must call Ohio EPA within 30 minutes, so the log mixes a few gallons of diesel on a highway shoulder with real releases; the reported volume is the caller's first estimate. Every report in Ohio EPA's open-data layer carries coordinates; air-pollution complaints and calls where nothing was found are left out of this count.
Source: Ohio EPA Emergency Response spill reports (Spills2 open data), reports with coordinates inside the ZIP boundary, 2021 to date · Ohio EPA spills data · Ohio EPA Office of Emergency Response
Oil and gas wells
1 to 10 wells2 wells in the ZIP0 producing · 0 shale · 0 orphan · nearest 1.32 mi
Source: ODNR Division of Oil and Gas Resources public well inventory (242,324 well heads, fetched 2026-09-08): wells inside each ZIP by status, horizontal shale wells, injection wells, orphan-program wells · ODNR oil and gas · ODNR GIS services
Full detail
Oil and gas wells
- Status
- 0 producing, 0 plugged or abandoned, the rest drilled but idle, gas storage, orphan, expired permits or unknown
Ohio has drilled since 1860, so most wells here are old, shallow and plugged; unplugged orphans and injection wells are the ones that matter for groundwater. Well-head points can be a few hundred feet off for the oldest records.
Source: Ohio Department of Natural Resources, Division of Oil and Gas Resources Management, public well inventory (well-head points); counts inside the ZIP boundary and within 1 mile of the ZIP's population-weighted center · ODNR oil and gas · ODNR GIS services
Abandoned mines
No mapped underground mineNo mapped minenearest 38.1 mi
Source: ODNR Mines of Ohio: abandoned underground coal and industrial-mineral mines mapped before 1977 (5,116 polygons), overlaid on ZCTA land in Albers equal-area; ODNR Division of Geological Survey industrial minerals locations, 2015 (active… · ODNR mines of Ohio · ODNR Geological Survey
Full detail
Abandoned mines
Undermined land can subside and old workings can discharge acid mine water; ODNR's Abandoned Mine Land program funds repairs, and mine-subsidence insurance is included automatically in 26 eastern counties and offered as an option in 11 more. Maps drawn before 1977 are incomplete, so "none" means none mapped.
Quarries, pits and working mines: 1 working operation inside this ZIP in 2015 (Enon Sand & Gravel, LLC, sand & gravel); nearest Enon Sand & Gravel, LLC (sand & gravel, Enon Sand & Gravel, LLC, 395,467 tons sold), 5.6 mi away in Clark County; 0 within 3 miles, 1 within 10 (ODNR Industrial Minerals Locations, 2015, which includes surface and underground coal mines).
Source: Ohio Department of Natural Resources, Mines of Ohio (abandoned underground mine maps, coal and industrial minerals, pre-1977), overlaid on the ZIP boundary in an equal-area projection · ODNR mines of Ohio · ODNR Geological Survey
Soils
Very limitedMiamian-Urban land complex, 2 to 6 percent slopesseptic very limited · well drained
Source: USDA NRCS SSURGO via Soil Data Access: the soil map unit under each ZIP's population-weighted center with its dominant component, drainage, hydric and farmland class, flooding, and the Ohio septic and basement interpretation ratings… · USDA Soil Data Access · Web Soil Survey · Open-Meteo elevation
Full detail
Soils and septic
- Soil
- Miamian-Urban land complex, 2 to 6 percent slopes; Miamian makes up 50% of the unit, 4% slope
- Water
- well drained; flooding none, ponding none
- Septic
- Very limited for a leach field under Ohio's rule
- Basements
- Somewhat limited for dwellings with basements
- Farmland
- Not prime farmland
- Elevation
- 1,007 feet above sea level at the ZIP's population center; Ohio runs from 455 feet where the Ohio River leaves the state to 1,549 feet at Campbell Hill
One point stands for the ZIP; soils change field by field, and a site evaluation is what the health department goes by. "Very limited" means the standard design will not work, not that nothing will.
Source: USDA Natural Resources Conservation Service, SSURGO soil survey via Soil Data Access; the map unit at the ZIP's population-weighted center and its dominant component's interpretations; Copernicus GLO-90 elevation model (via Open-Meteo) at that center · USDA Soil Data Access · Web Soil Survey · Open-Meteo elevation
Parks
2 to 5%4.0% public land · 318 acresGeorge Rogers Clark Park · Buck Creek State Park 4.8 mi
Source: USGS Protected Areas Database 4.1 (Ohio state package, flattened combined layer, open-access fee, designation and easement polygons plus the six ODNR state parks PAD-US codes closed by default: Buckeye Lake, Forked Run, Hueston Woods, Lake… · USGS PAD-US · ODNR GIS services
Full detail
Parks and public land
- George Rogers Clark Park
- local park, 139 acres inside the ZIP
- Virgil A. Mabra Park
- local park, 78 acres inside the ZIP
Nearest state park: Buck Creek State Park, 4.8 mi.
Protected land: 4.1% of this ZIP (319 acres) is in the USGS Protected Areas Database inventory of fee-owned parks, preserves and recreation land (public agencies, land trusts, and private clubs, camps and utility land, as their owners report it): 310 acres local, 9 acres private. Largest: George Rogers Clark Park (county), 139 acres; Virgil A. Mabra Park (city), 78 acres; Davey Moore Park (city), 45 acres. 4% of the ZIP is protected land open to the public.
Trails: 7.8 miles of named trails cross this ZIP: Little Miami Scenic Trail (5 mi, regional trail); North Country Trail (2.7 mi, national trail); Buck Creek Trail (0.1 mi, county trail); 2.3 miles more are proposed or planned (ODNR statewide trails inventory).
Open access as reported by each owner; local inventories vary, so a golf course or school field can be listed and a new park missed.
State lands nearby (ODNR facility layers): nearest boat ramp: Boat Ramp at Buck Creek State Park, 6.2 mi (0 within 5 miles); fishing access: Fishing Access at Buck Creek State Park, 5.5 mi (0 within 5 miles); swim area: Boat Swim Area at Caesar Creek State Park, 27.6 mi (0 within 5 miles); campground: Campground/Campsite at Buck Creek State Park, 7 mi (0 within 5 miles).
Source: USGS Protected Areas Database of the United States 4.1 (open-access fee, designation and easement polygons), overlaid on the ZIP boundary; straight-line miles from the ZIP's population-weighted center to the nearest ODNR state park · USGS PAD-US · ODNR GIS services
Wetlands
1 to 3%1.5% wetland · 116 acrespond 45 · forested/shrub wetland 39 · emergent wetland 32
Source: USFWS National Wetlands Inventory, Ohio geodatabase (imagery mostly 2004 to 2007, Lake Erie basin 2021), freshwater wetlands and ponds clipped to each ZIP (lakes and rivers excluded); Ohio EPA potential high-quality vernal pools… · USFWS wetlands inventory · Ohio EPA GIS services
Full detail
Wetlands
45 acres pond, 39 acres forested/shrub wetland, 32 acres emergent wetland. Largest single wetland: 14 acres of freshwater emergent wetland.
High-quality wetlands: nearest is Gallagher/Springfield Fen SNP (Ohio DNR), 9 acres, 5.9 mi away; 4 within 10 miles.
Mitigation sites: nearest SR794 Realignment, 2.8 mi away (a permittee-responsible site under an environmental covenant); 1 within 10 miles. These are wetlands and streams built or restored to replace ones filled under Clean Water Act permits.
Assessed wetland: nearest Gallagher Fen, a fen of 3 acres, 6 mi away: ORAM 81 of 100 (category 3), plant community index 97 of 100 (surveyed 2001); 3 within 10 miles. Category 3 wetlands are the state's best and hardest to fill; category 1 are degraded.
Mapped from aerial photography, mostly 2004 to 2007 (the Lake Erie watersheds were re-mapped from 2021 imagery, a few areas date from 1976 to 2005 or 2014 to 2023), so small and seasonal wetlands are undercounted and ponds dug or filled since then are missing; a site delineation decides whether a lot is jurisdictional. Emergent means marsh, forested and shrub means swamp.
Source: U.S. Fish and Wildlife Service, National Wetlands Inventory (Ohio geodatabase), freshwater wetland and pond polygons clipped to the ZIP boundary; lakes and river channels excluded, imagery mostly 2004 to 2007 (Lake Erie basin 2021) · USFWS wetlands inventory · Ohio EPA GIS services
Land cover
40% to 75%46% developed · 19% tree canopycropland 23% · forest 18% · pasture 9%
Source: National Land Cover Database 2021 (USGS and the MRLC consortium): land cover, percent impervious surface and tree canopy at 30 m, pulled as WCS tiles from mrlc.gov and summarised over each ZCTA boundary; USDA NASS Cropland Data Layer 2025… · NLCD · USDA Cropland Data Layer · ODNR pre-settlement vegetation
Full detail
Land cover
- Developed
- 46%: 3% high intensity (downtown blocks, big-box lots), 9% medium (apartments, small-lot houses), 19% low (houses on larger lots), 16% open space (lawns, parks, golf courses, road verges)
- Farmland
- 32%: 23% row crops, 8.8% pasture and hay
- Crops 2025
- of 1,553 cropped acres, 56% soybeans, 35% corn, 0% wheat and small grains, 4% hay and alfalfa, 6% vegetables, orchards, fallow and other crops; 797 acres of pasture and grass (USDA Cropland Data Layer)
- Forest
- 18%
- Water and wetland
- 1.6% open water, 1.6% wetland
- Paved and roofed
- 16% of the ZIP's surface is impervious; rain that lands there runs straight to a storm drain or stream instead of soaking in
- Tree canopy
- 19% of the ZIP sits under tree canopy
- Area
- 12.1 square miles of land
Land cover is classified from Landsat imagery at 30 metre pixels, so a house on a wooded lot can read as forest and a farm lane as open space. Stream health starts to slip once about 10% of a watershed is impervious, and is usually poor above 25%.
Source: National Land Cover Database 2021 (USGS and the Multi-Resolution Land Characteristics Consortium): land cover, percent impervious surface and tree canopy at 30 m, summarised over the ZIP boundary · NLCD · USDA Cropland Data Layer · ODNR pre-settlement vegetation
People and health
Who lives here and how well: education, jobs, health and life expectancy, and how far the nearest hospital, police station or grocery store sits.
People
Under 15% with a bachelor's degree14.3% bachelor's or higher54.8% white · 29.6% Black · 6.7% Hispanic · 0.5% Asian · 4.6% foreign-born
Source: Census ACS 2020-2024 5-year by ZCTA: educational attainment (B15003), race and Hispanic origin (B03002), nativity (B05002), veterans (B21001); IRS Statistics of Income county migration flows 2022 to 2023 for the county; Census Bureau… · Census ACS · Census population estimates · IRS migration data · USDA ERS county codes · USDA ERS commuting area codes · 2020 Census redistricting data · Census SAIPE · IRS exempt organizations
Full detail
People
- Education
- 14.3% of adults 25+ hold a bachelor's degree or higher, 4% a graduate degree; 53.7% stopped at high school or earlier
- Ages
- 22.5% under 18, 18.5% 65 or older
- Race and origin
- 54.8% white, 29.6% Black, 6.7% Hispanic or Latino, 0.5% Asian, 8.4% other or two or more races
- Born abroad
- 4.6% of residents (612 people); largest countries of birth: Haiti (197), Mexico (96), United Kingdom (56)
- Veterans
- 9.3% of adults
- Households
- 2.3 people per household on average; 33% of households are one person living alone, 30% married couples
- Who lives here
- 30% of households include children, 35% someone 65 or over and 16.6% are a senior living alone; of people 15 and over, 37% are married, 38% never married, 15% divorced and 10% widowed
- Poverty
- 24.3% of residents live below the poverty line, 32.6% of children and 18.4% of people 65 and over; the Gini index of income inequality is 0.47 (0 would mean every household earns the same, 1 that one household earns everything). County-wide, the Census Bureau's 2024 estimate is 14.1% (20.0% of children) with a median household income of $65,529 (SAIPE)
- Ancestry
- most often reported: German 14%, Irish 9%, American 6%
- Movers
- 13.0% of residents lived somewhere else a year earlier, 1.8% in another state and 0.3% abroad
- Language
- 2.0% of households speak limited English; 4.4% speak Spanish at home
- Group quarters
- 154 of the 13,330 people counted here in 2020 (1.2%) lived in group quarters: 74 in nursing facilities, 71 in other group housing such as shelters, group homes and worker dormitories, 9 in juvenile facilities (2020 Census)
- Moving
- 4,621 people moved into Clark County between the returns they filed in 2022 and 2023 and 4,672 moved out (net −51, 102,722 stayed put); most arrivals came from Montgomery, OH (758), Franklin, OH (627), Greene, OH (533); most leavers went to Montgomery, OH (823), Greene, OH (659), Franklin, OH (473) (IRS)
- Metro or rural
- USDA rural-urban continuum code 3 of 9 for Clark County: metro - counties in metro areas of fewer than 250,000 population
- Nonprofits
- 55 tax-exempt organizations registered to addresses in this ZIP, 4 of them reporting $1 million or more in income; 98% are 501(c)(3) charities and 35% churches or religious groups; largest: Sheltered Inc ($2 million), Housing Connection Of Clark County Inc ($1 million), Springfield Sports Academy ($1 million) (IRS)
- County growth
- Clark County went from 135,975 people in April 2020 to 135,340 in July 2025 (-0.5%): 7,926 births, 9,975 deaths and a net +1,509 from migration since 2020; in 2025 alone a net 908 left for elsewhere in the U.S. and 281 arrived from abroad (Census estimates)
- Since 1900
- First counted in 1820 with 9,533 people and 22,178 by 1850, Clark County counted 58,939 people in 1900, 111,661 in 1950, 157,115 in 1970, 144,742 in 2000 and 135,975 in 2020; it peaked at 157,115 in 1970 (2.3 times its 1900 size, decennial censuses)
Commuting area: USDA classes this ZIP as the core of a metropolitan area (rural-urban commuting area code 1 of 10, 2020 edition).
Race shares follow the Census categories, with Hispanic origin counted separately from race. Five-year averages centered on 2022. Moves count people on tax returns whose address changed county, so students and the very poor are undercounted.
Source: Census Bureau, American Community Survey 2020 to 2024 five-year estimates by ZIP Code Tabulation Area (tables B15003, B03002, B05002, B21001, B01001, B25010, B11001, B17001, B19083, B04006, B07003, C16002, B05006, B11005, B11007, B12001); county population estimates, vintage 2025; IRS exempt organization master file; USDA rural-urban continuum codes 2023; USDA ERS rural-urban commuting area codes 2020; 2020 Census PL 94-171 redistricting file, group quarters (table P5); IRS Statistics of Income county migration, returns filed in 2022 and 2023; Census SAIPE 2024 county poverty and median income; decennial county counts from the Census Bureau report Population of States and Counties of the United States 1790 to 1990 · Census ACS · Census population estimates · IRS migration data · USDA ERS county codes · USDA ERS commuting area codes · 2020 Census redistricting data · Census SAIPE · IRS exempt organizations
Jobs
0.6 to 14,025 jobs · 5,521 employed residentsManufacturing leads · residents mostly work in Springfield (45505)
Source: Census LEHD LODES 8, 2023, all jobs: workplace and residence counts by census block summed into ZCTAs (workplace-only blocks by block-group or tract majority), origin-destination flows for where residents work; Census ZIP Code Business… · Census LEHD · BLS local unemployment · BLS QCEW · BEA county GDP · USAspending · OSHA enforcement data · Census ZIP Business Patterns · Census ACS · USDA ERS county typology · CDFI Fund Opportunity Zones
Full detail
Jobs and commuting
Largest employers by sector: Manufacturing 866, Transportation and warehousing 613, Education 573. 50% of local jobs pay over $3,333 a month, and 46% of residents' jobs do.
Businesses: 134 establishments with 1,977 employees and $86 million a year in payroll in 2023, 4 of them with 100 or more workers; most common: other services (20), manufacturing (17), construction (15), restaurants and hotels (15) (ZIP Business Patterns).
Workplace safety (OSHA): 10 inspections of workplaces in this ZIP since 2020 (1 after deaths or injury reports, 2 after complaints, 5 on referrals); most inspected: Mcgregor Metal Llc (2), C.I.R.E.S., Inc (1), Oldcastle Apg Inc. Dba Oldcastle Lawn & Garden (1). 2 worker deaths investigated since 2015 and 2 hospitalisations: 2023, employee is killed when pulled into unguarded lathe; 2016, roofer falls 15 feet through a hole in a roof and is killed.
County labor market: Clark County's unemployment rate was 3.9% in July 2026 (5.3% a year earlier), with 60,229 people in the labor force and 2,326 looking for work. Employers in the county paid an average of $1,041 a week in the first quarter of 2026 (up 1.7% on the year) to 43,714 workers at 2,488 establishments, employment down 4.0%; the largest private sectors are health care and social assistance (6,724 jobs, $1,186 a week), manufacturing (6,270 jobs, $1,203 a week), retail (4,598 jobs, $672 a week). (BLS)
Working-age residents: 55.2% of people 16 and over here are in the labor force, and 10.2% of the civilian labor force was unemployed, averaged over 2020 to 2024 (Census ACS). Residents' most common occupations: production 13%, office and administrative support 12%, management and business 11%; 7% are self-employed and 12% work for a government.
Federal money: in fiscal 2025 the federal government obligated $66 million in contracts performed in Clark County ($484 a resident) and $148 million in grants ($1,085 a resident), plus $356,000 in loan guarantees and loans and $885 million in direct payments to people and organizations (USAspending; Social Security, Medicare and most benefits are not counted).
County economy: Clark County produced $4.7 billion of real GDP in 2024 (2017 dollars, up 0.9% since 2019); personal income came to $52,869 a person in 2024, 60th of Ohio's 88 counties and up 29% since 2019 before inflation (BEA).
County type (USDA ERS, 2015 codes): Clark County is a metro county with a nonspecialized economy, flagged for population loss.
Opportunity zone: 26% of residents live in a census tract designated a federal Qualified Opportunity Zone in 2018, where investors who put capital gains into local projects get tax breaks (CDFI Fund list, 2010 tracts carried to 2020 boundaries).
How they get there: 76.7% drive alone, 7.9% carpool, 1.1% transit, 1.5% walk, 1.7% bike, 10.6% work from home (ACS).
Where residents work: 6% inside this ZIP; 12% in Springfield (45505), 9% in Springfield (45504), 8% in Springfield (45503) (shares of the 5,404 residents with an Ohio workplace).
Unemployment-insurance records tie each job to a workplace and a home address; large employers sometimes report every worker at a headquarters, which inflates a few ZIPs. Self-employment, the military, the Postal Service, most farm work and a large part of federal civilian employment are missing (federal jobs come from OPM records that omit several agencies and, in practice, most of Wright-Patterson).
Source: Census Bureau LEHD Origin-Destination Employment Statistics (LODES 8), 2023, all jobs; populated census blocks assigned to ZIP Code Tabulation Areas by interior point, workplace-only blocks by the majority ZCTA of their block group or tract; Census ZIP Code Business Patterns 2023; OSHA enforcement data via the Labor Department open data catalog; BLS county unemployment (LAUS) and wages (QCEW); Census ACS 2020 to 2024 labor force by ZIP Code Tabulation Area (B23025); USAspending federal awards by county, fiscal 2025; BEA county GDP and personal income · Census LEHD · BLS local unemployment · BLS QCEW · BEA county GDP · USAspending · OSHA enforcement data · Census ZIP Business Patterns · Census ACS · USDA ERS county typology · CDFI Fund Opportunity Zones
Upward mobility
Below the 35th percentilePercentile rank 32income rank at 35 for children of low-income parents · 4.85% incarcerated in 2010
Source: Opportunity Atlas (Chetty, Friedman, Hendren, Jones and Porter, Census Bureau): tract outcomes for children born 1978 to 1983, population-weighted to ZIPs through 2020 census blocks · Opportunity Atlas · Opportunity Insights data
Full detail
Upward mobility
- Meaning
- among the lowest in Ohio: most low-income children stayed near the bottom
- Incarceration
- 4.85% of those children were in jail or prison on census day 2010
- Coverage
- 100% of the ZIP's residents live in tracts with an estimate
The rank describes people born around 1980 who were children here in the 1980s and 1990s; neighbourhoods change, so it is a record of what the place did for one generation, not a forecast. Estimates for small tracts are noisy.
Source: Opportunity Atlas tract outcomes (Chetty, Friedman, Hendren, Jones and Porter, 2018; Census Bureau and IRS data for children born 1978 to 1983), population-weighted to ZIPs through 2020 census blocks · Opportunity Atlas · Opportunity Insights data
Social vulnerability
60th to 80th75th percentile of Ohio tractssocioeconomic 75 · household 79 · minority status 72 · housing and transport 49
Source: CDC/ATSDR Social Vulnerability Index 2022 by census tract (percentile ranks among Ohio tracts), population-weighted to ZIPs through 2020 census blocks · CDC/ATSDR SVI
Full detail
Social vulnerability
- Socioeconomic status
- 75th percentile: poverty, unemployment, housing cost burden, no high school diploma, no health insurance
- Household characteristics
- 79th: people 65 and over or 17 and under, disability, single-parent households, limited English
- Racial and ethnic minority status
- 72nd
- Housing and transportation
- 49th: multi-unit and mobile homes, crowding, no vehicle, group quarters
The index ranks tracts on how much help their residents would need in a disaster or disease outbreak, using American Community Survey 2018 to 2022 figures. Ranks are within Ohio; a ZIP is the average of its tracts weighted by residents.
Source: CDC/ATSDR Social Vulnerability Index 2022, census tracts ranked among Ohio tracts, population-weighted to the ZIP through 2020 census blocks · CDC/ATSDR SVI
Health
25% or more30.9% in fair or poor healthobesity 49.5% · diabetes 20.4% · smoking 23.7% · depression 26.5%
Source: CDC PLACES 2025 release, ZCTA model-based estimates of adult health (BRFSS 2023, ACS): fair or poor health, obesity, diabetes, smoking, depression, uninsured and more; County Health Rankings 2025 (University of Wisconsin Population Health… · CDC PLACES · County Health Rankings · CDC overdose data · NCI cancer profiles · HRSA data
Full detail
Community health
- Weight and activity
- obesity 49.5%, no leisure-time physical activity 42.2%
- Chronic conditions
- diabetes 20.4%, high blood pressure 47.8%, COPD 12.6%, cancer (any but non-melanoma skin cancer) 7.7%
- Habits
- current smoking 23.7%, binge drinking 12.3%, short sleep 45.0%
- Mind
- depression 26.5%, frequent mental distress 21.4%, feeling lonely 37.6%
- Access
- uninsured under 65 11.9%, yearly checkup 81.2%, dental visit 48.8%
- Hardship
- any disability 40.7%, food insecurity 29.7%
- Heart and lungs
- current asthma 12.9%, coronary heart disease 9.5%, stroke 5.8%, arthritis 34.8%
- Keeping up
- 81.1% of adults with high blood pressure take medicine for it, 83.7% had a cholesterol check in 5 years
- Social needs
- housing insecurity 21.3%, no reliable transportation 15.1%, utility shut-off threat 17.6%, lacking emotional support 26.3%
- Provider shortage
- 100% live in an area HRSA designates a primary care shortage area for its low-income residents (score 16 of 25); 84% live in an area HRSA designates a dental shortage area for its low-income residents (score 14 of 26); 100% live in an area HRSA designates a mental health shortage area for its low-income residents (score 17 of 25) (HRSA; higher scores mean greater need)
- Coverage (Census)
- 7.3% of residents have no health insurance (4.6% of children); 36% are on Medicaid and 35% have coverage through an employer
- Disability (Census)
- 20.5% of residents report a disability, 38% of those 65 and over
County (County Health Rankings 2025): Clark County sits in health group 7 of 10 among U.S. counties for population health (1 is healthiest) and group 6 for community conditions. Premature death 12,878 (Ohio 9,740) years of life lost before 75 per 100,000; one primary care doctor for every 2,223 people (Ohio 1,328), one mental health provider for every 467 people (Ohio 286), one dentist for every 1,665 people (Ohio 1,535); preventable hospital stays 2,891 (Ohio 3,033) per 100,000 Medicare enrollees; injury deaths 132.4 (Ohio 100.7) and suicides 22.0 (Ohio 14.7) per 100,000; infant deaths 7.8 (Ohio 7.0) per 1,000 births; teen births 28.6 (Ohio 17.4) per 1,000 girls 15 to 19; children in poverty 21.4 (Ohio 17.5) percent; fine-particle air pollution 7.8 (Ohio 7.8) micrograms per cubic metre; at least one community water system in the county had a health-based drinking water violation in 2023. Drug overdoses: 32 deaths in the 12 months ending December 2025 (27 a year earlier, 90 at the highest since 2020, in the 12 months ending October 2021), about 23.8 per 100,000 residents against 20.8 statewide (CDC provisional counts).
Cancer (NCI State Cancer Profiles): Clark County records 492.2 new cancers a year per 100,000 people, age-adjusted, for 2018 to 2022 (Ohio 472.9, U.S. 448.6), about 923 cases a year, with the rate stable; cancer deaths 170.9 per 100,000 (Ohio 160.3, U.S. 145.4), falling. By site, per 100,000 (Ohio in parentheses): lung 77.3 (63.6), colorectal 39.9 (38.4), female breast 137.2 (133), prostate 111.4 (120.8), bladder 22.9 (21.8), leukemia 12.9 (13).
Medicare: 31,883 people in Clark County were on Medicare in 2025 (24% of residents): 28,133 aged 65 or over and 3,750 younger people with disabilities. 60% chose a Medicare Advantage plan, 17% also had Medicaid and 82% had Part D drug coverage; enrollment is up 3% since 2020 (CMS).
Modelled from a national telephone survey and the ZIP's demographics, so these are estimates of what residents would report, not counts of patients; small ZIPs carry wide margins.
Source: CDC PLACES, 2025 release (BRFSS 2023 and 2022, ACS 2019-2023), model-based ZCTA estimates of crude adult prevalence; County Health Rankings 2025 and CDC provisional overdose counts for the county; HRSA shortage area designations weighted to the ZIP; Census ACS 2020 to 2024 (insurance, disability); CMS Medicare Monthly Enrollment, county, 2025 · CDC PLACES · County Health Rankings · CDC overdose data · NCI cancer profiles · HRSA data
Life expectancy
Under 73 years71.2 years life expectancy13 tracts, from 67.5 to 80.6
Source: CDC/NCHS U.S. Small-area Life Expectancy Estimates Project (USALEEP, deaths 2010-2015, 2010 census tracts) weighted into ZIPs by 2020 block population · CDC USALEEP
Full detail
Life expectancy
Ohio's statewide figure for the same years was 77.6; the United States 78.7. Differences of a year or two between neighbouring ZIPs are within the estimates' error; differences of five or more are real and track income, smoking and access to care.
Source: CDC National Center for Health Statistics, U.S. Small-area Life Expectancy Estimates Project (USALEEP), 2010-2015, census tracts weighted by 2020 block population · CDC USALEEP
Hospitals
Under 3 milesMercy Health Springfield Regional Medical Center · 1.6 miSpringfield · 647 beds · 1 within 10 miles
Source: CMS Timely and Effective Care measure OP_18b (median emergency department time, October 2024 to September 2025); Veterans Health Administration medical facilities (HIFLD copy of the VA station list, S_STATE OH); HRSA health center service… · CMS Care Compare data · HIFLD · HRSA data · CMS NPI files
Full detail
Nearest hospital
647 beds · no trauma designation listed · 1 general or critical-access hospital within 10 miles, 12 within 25.
Medicare rating: ★★★★☆ · emergency room: yes · typical ER visit 146 minutes door to discharge (Ohio median 155)
Patients' verdict: 55% would definitely recommend it, 62% rated their stay 9 or 10 out of 10 (★★☆☆☆ patient-experience rating, 1,561 surveys).
Outcomes: 30-day death rates after heart failure 11.4% (about the national rate), heart attack 10.7% (about the national rate), pneumonia 15.8% (about the national rate), July 2022 to June 2025; the patient-safety composite for serious complications (July 2022 to June 2024) is about the national value (Medicare).
Community health center: 3 inside this ZIP, nearest Rocking Horse Center - Mulberry Terrace, Springfield, 1.2 mi away; 3 within 3 miles, 4 within 10. These federally funded clinics see anyone and charge on a sliding scale.
Veterans: nearest VA site is Springfield VA Clinic, Springfield (multi-specialty outpatient clinic), 2.8 mi away; 1 VA site within 10 miles, 4 within 25.
Providers: 177 active health care providers list a practice address in this ZIP: 4 nurse practitioners and physician assistants, 3 dentists, 25 mental health professionals, 1 urgent care center, 2 nursing or assisted-living facilities, 3 home health or hospice agencies (NPPES registry, August 2026).
Dialysis: nearest Davita Midwest Springfield Dialysis, Springfield, 3.3 mi away, 21 stations, Medicare ★★★☆☆ (DaVita); 2 within 5 miles, 5 within 15.
Source: federal HIFLD hospital inventory (via FEMA) with Medicare Care Compare star ratings, emergency-service flags, median emergency department times (measure OP_18b), HCAHPS patient survey results and 30-day death rates and patient-safety composites (Complications and Deaths file; a campus with no record of its own carries its parent hospital's figures, labelled); NPPES NPI registry, August 2026 monthly file, active records by practice ZIP; straight-line miles from the ZIP's population-weighted center (some listings lag closures and mergers); HRSA health center sites, CMS dialysis facilities (geocoded with the Census geocoder) and the VA facility list · CMS Care Compare data · HIFLD · HRSA data · CMS NPI files
Nursing homes
Under 1 mileSOUTHBROOK HEALTHCARE CENTER · 0.8 mi3 of 5 stars · 98 beds · 9 within 5 miles
Source: CMS Care Compare nursing home provider file (922 Ohio homes), addresses geocoded with the Census Bureau batch geocoder (67 unmatched placed at their ZIP center); CMS penalties file (fines and payment denials since 2023, matched by name and… · CMS Care Compare data
Full detail
Nursing homes
9 certified homes within 5 miles, 17 within 15; 1 inside this ZIP.
- Medicare rating
- ★★★☆☆ overall; inspections ★★☆☆☆; staffing ★★☆☆☆
- Beds
- 98 certified
- Ownership
- For profit, limited liability company
- Penalties
- no federal fines or payment denials since 2023 (CMS)
In this ZIP: SOUTHBROOK HEALTHCARE CENTER (3★, 98 beds).
Stars are Medicare's Care Compare ratings; a 1-star home failed inspections or is thinly staffed, and the abuse flag means a citation for harm in the past year or two. Ratings shift every quarter.
Source: Medicare Care Compare nursing home provider and penalties files (CMS), geocoded with the Census Bureau; straight-line miles from the ZIP's population-weighted center · CMS Care Compare data
Crime
10 or more13.8 violent offenses per 1,000Springfield Police · 46.6 property per 1,000 · 12 months
Source: FBI Crime Data Explorer NIBRS incident files for Ohio, 2024 (2023 file for the trend): Group A offenses counted per reporting agency, offenses against persons counted per victim, with each ZIP assigned the police department of its largest… · FBI Crime Data Explorer · USGS structures service
Full detail
Crime
- Violent
- 798 offenses: 4 murders, 43 rapes, 139 robberies, 612 aggravated assaults (13.8 per 1,000 residents; Ohio 3.2)
- Property
- 2,696 offenses: 516 burglaries, 1,663 thefts, 455 vehicle thefts (46.6 per 1,000; Ohio 16.9)
- Other
- 1,434 simple assaults, 959 vandalism reports, 5 drug offenses, 26 weapons violations
- Reporting
- 12 months of 2024 on file; 57,911 residents served; this department covers the 75% of the ZIP's residents in its territory, the rest fall under others
- Trend
- violent offenses up 9% from 731 in 2023; property down 5% from 2,833
Rates cover the whole agency's territory, not this ZIP alone: a city's downtown and its quiet edges share one number. Murders, rapes and assaults are counted once per victim and other offenses once per incident, as the FBI's Crime Data Explorer does; a large department's figures can still fall somewhat short of the Explorer's, which takes in later submissions, and a sheriff's population is only the unincorporated area it serves.
Source: FBI Crime Data Explorer, NIBRS incident data for Ohio, 2024 (2023 for the trend): Group A offenses per reporting agency (violent = murder, rape, robbery, aggravated assault; property = burglary, larceny, motor vehicle theft, arson), murders, rapes and assaults counted once per victim; the agency is the police department of the ZIP's largest local government (city, village or township) when it has one of its own, found in the FBI's 2023 and 2024 rosters or the USGS police station inventory, otherwise the sheriff of the ZIP's county; a rate needs at least six months of 2024 on file and is annualized from fewer than 12; the Ohio figures pool the 511 police departments and sheriff's offices with all 12 months on file · FBI Crime Data Explorer · USGS structures service
Police
Under 1 mileSpringfield Police Department South Substation · 0.9 mi4 stations within 3 miles · post office 1.7 mi
Source: USGS National Map structures: police stations (773 Ohio points: the inventory's 731 less 3 closed or duplicate records, with 4 wrong names corrected, plus 45 departments and sheriff's offices it lacks, placed from OpenStreetMap or the… · USGS structures service · OpenStreetMap · Census Bureau geocoder
Full detail
Police and post office
4 stations within 3 miles, 7 within 8. Inside this ZIP: Springfield Police Department South Substation.
Nearest post office: Springfield Post Office, 1.7 mi.
Townships without their own department are policed by the county sheriff, whose office may be at the county seat; the state highway patrol covers the roads. The inventory lists stations, not patrol zones. It also misses some departments and still lists some that have closed; the atlas adds the departments that reported at least six months of 2024 crimes to the FBI but had no station in it, and drops the closed and duplicate records it found.
Source: USGS National Map structures inventory (police stations, post offices), with closed and duplicate records dropped, wrong names corrected and departments it lacks added from OpenStreetMap and the Census Bureau geocoder (September 2026); straight-line miles from the ZIP's population-weighted center · USGS structures service · OpenStreetMap · Census Bureau geocoder
Fire and EMS
1 to 2 milesSpringfield Fire and Rescue Division Station 8 · 1.2 mi7 stations within 3 miles, 18 within 8
Source: USGS National Map structures inventory (fire and EMS stations; most Ohio records last updated 2019 to 2022): 1,772 Ohio stations after removing duplicate records and checking Columbus- and Cleveland-area stations against the cities'… · USGS structures service · Columbus fire stations · Cleveland fire stations
Full detail
Fire and EMS
7 stations within 3 miles, 18 within 8.
Inside this ZIP: Springfield Township Fire / EMS Station 1.
Source: USGS National Map structures inventory (fire and EMS stations; most Ohio records last updated 2019 to 2022), Columbus- and Cleveland-area stations checked against the cities' station lists, September 2026. Indiana, Michigan and Pennsylvania stations near the line are included; Kentucky and West Virginia stations across the Ohio River are not. Straight-line miles from the ZIP's population-weighted center. Stations open or close without the inventory always catching up. · USGS structures service · Columbus fire stations · Cleveland fire stations
Libraries
1 to 2 milesSouthgate Branch Library · 1.1 miClark County Public Library · 3 within 3 miles, 6 within 8
Source: IMLS Public Libraries Survey FY2024 outlet and system files (720 open Ohio central libraries and branches of 251 systems, plus 62 bookmobiles); straight-line miles from each ZIP's population-weighted center; IMLS Museum Data Files 2018… · IMLS Public Libraries Survey · IMLS Museum Data Files
Full detail
Public library
3 libraries within 3 miles, 6 within 8.
- Open
- about 54 hours a week
- Building
- 6,000 square feet
- Clark County Public Library
- 6 buildings, serves 130K people, 2.7 visits per resident a year, 747K items lent, 995 programs, $9.1M annual income
Inside this ZIP: Clark County Public Library; Southgate Branch Library.
Museums: nearest Wescott House Foundation, historical society, Springfield, 1.7 mi away; 5 within 5 miles, 20 within 15 (IMLS 2018 directory: museums, historical societies, gardens and zoos).
Source: Institute of Museum and Library Services, Public Libraries Survey fiscal 2024 (outlet and system files) and Museum Data Files 2018 (museums); straight-line miles from the ZIP's population-weighted center · IMLS Public Libraries Survey · IMLS Museum Data Files
Groceries
33 to 66%42.8% in low-income, low-access tracts49% over 1 mile from a supermarket · 33% of households on SNAP (ACS)
Source: USDA Food Access Research Atlas 2019 Large Retailer Access Map (2010 tracts, ERS's name for the file since July 2026) weighted by 2020 block population: distance to the nearest supermarket and low-income low-access flags; Census ACS… · USDA ERS Large Retailer Access Map · USDA SNAP retailers · Census ACS
Full detail
Grocery access
- Distance
- 84% of residents live more than half a mile from a supermarket, 49% more than 1 mile
- Without a car
- 15% live in a tract flagged for low income and low vehicle access; 15.2% of households have no vehicle (Census ACS 2020 to 2024)
- Poverty
- 24% of residents below the poverty line
- SNAP stores
- 1 supermarket or superstore and 1 grocery store inside this ZIP take SNAP, alongside 5 convenience stores, 3 other outlets (dollar, drug and discount stores); nearest supermarket or grocery store Adasa Latin Market Inc (supermarket), 1 mi from the ZIP's center; 13 supermarkets and grocery stores within 3 miles (USDA, 2026)
- SNAP households
- 33% of households received SNAP benefits in the past year (Census ACS 2020 to 2024)
- Setting
- 92% of residents in urban tracts, across 13 tracts, 5 flagged
A "supermarket" here is a large grocery store, supercenter or club; dollar stores and corner groceries do not count, and stores that opened since 2019 are missing from the distance figures; the SNAP store list is current. Rural distance flags mean a long drive, not necessarily hardship.
Source: USDA Economic Research Service, Food Access Research Atlas: 2019 Large Retailer Access Map (2010 census tracts, 2019 supermarket list; ERS's name for this file since July 2026), tract values weighted into ZIPs by 2020 census block population; SNAP store counts from USDA Food and Nutrition Service retailer locations, 2026; SNAP and no-vehicle households from Census ACS 2020 to 2024 · USDA ERS Large Retailer Access Map · USDA SNAP retailers · Census ACS
History, schools and government
How the place began, who governs it now, and the schools that serve it, from the district boundary to its state report card.
Local history
No datahistory not researched yet
Source: Local history researched from Wikipedia, the 1880 county histories on archive.org, Ohio History Connection, National Register listings, Ohio historical markers, local historical societies and Wikimedia Commons, one file per municipality… · Ohio History Connection · Internet Archive (county histories) · Wikimedia Commons · Remarkable Ohio (historical markers)
Full detail
History
The history of this area has not been researched yet; the work runs county by county outward from Franklin County.
Source: Local history researched from Wikipedia, the 1880 county histories on archive.org, Ohio History Connection, National Register listings, Ohio historical markers, local historical societies and Wikimedia Commons, one file per municipality and township, loaded on demand; Native American history per county and statewide from the same sources and the nations' own histories · Ohio History Connection · Internet Archive (county histories) · Wikimedia Commons · Remarkable Ohio (historical markers)
Historic places
3 to 65 listed historic placesBookwalter, Francis, House
Source: National Park Service, National Register of Historic Places point file (3,286 points for 3,232 of Ohio's roughly 4,200 listings; listings without a point are not counted, and a listing with several points is counted once); listings inside… · National Register data · USGS GNIS
Full detail
Historic places
- Bookwalter, Francis, House (building)
- Hertzler, Daniel, House (building)
- Myers Daily Market (building)
- and 2 more
Place names (USGS): 7 named communities (Durbin, Green Hedges, Possum Woods, Park Ridge Acres, Southgate and more); 2 named streams end here (Mill Creek, Rock Run); 1 named lake or reservoir (Hosterman Lake). Federal maps carry these names; the communities include hamlets and crossroads that never incorporated.
Listing recognizes significance and brings review of federally funded projects; it does not restrict a private owner. Historic districts count once, at their center.
Source: National Park Service, National Register of Historic Places spatial data (point file); listings whose point falls inside the ZIP boundary · National Register data · USGS GNIS
Schools
193 city school districtsSpringfield CityCity school district · 74% of residents, then Clark-Shawnee Local
Source: Ohio school district boundaries (OGRIP 2014 via ODOT) by resident share; NCES EDGE 2024-25 school buildings; NCES Private School Survey 2023-24 public-use file (schools inside the ZIP by coordinates); Census ACS 2020-2024 B14002 school… · ODOT GIS · NCES EDGE · NCES Common Core of Data · NCES private schools · Census SAIPE · Census school finances (F-33)
Full detail
School district
- Springfield City74% of residentsCity school district
- Clark-Shawnee Local18% of residentsLocal school district
- Greenon Local6% of residentsLocal school district
ZIP codes and school districts do not share boundaries, so this ZIP is split between them.
4 public schools inside this ZIP: Clark Early Learning Center; Fulton Elementary School (2.5 stars); Perrin Woods Elementary School (2.5 stars); Springfield Sports Academy. Nearest to the population center: Perrin Woods Elementary School (2.5 stars), 0.5 mi; 2 within a mile, 17 within 3.
Enrolled here: 1,264 students attend the 4 public schools inside this ZIP with 2023-24 enrollment on file; 1 of them is a charter school (78 students), 14 students per teacher. 3 of them serve free meals to every student under the community eligibility provision. (NCES)
Enrollment: 2,254 residents attend kindergarten through 12th grade, 25% of them at private schools; 801 are in college or graduate school (Census ACS 2020 to 2024).
Money, fiscal 2023: Springfield City took in $139 million, 55% from the state, 26% local and 19% federal, and spent $16,018 per pupil on day-to-day operations for 7,099 students, 55% of it on instruction; capital outlay $7.5 million (Census school finance survey via NCES).
Child poverty: the Census Bureau's 2024 estimate puts 27% of Springfield City's school-age children below the poverty line (2,425 of 9,126 aged 5 to 17; SAIPE).
Source: Ohio school district boundaries (OGRIP, 2014 edition, via ODOT) · 2020 census blocks · public school locations from NCES EDGE, 2024-25 · enrollment and meals from the NCES Common Core of Data 2023-24 · private schools from the NCES Private School Survey 2023-24 · district finances from the Census F-33 survey, fiscal 2023 · child poverty from Census SAIPE 2024 · ODOT GIS · NCES EDGE · NCES Common Core of Data · NCES private schools · Census SAIPE · Census school finances (F-33)
School ratings
2.5 stars or fewer2.5 stars overallSpringfield City · performance index 54.8% of the year's maximum · 88.8% graduate in four years
Source: Ohio School Report Cards 2024-2025 (Department of Education and Workforce): district overall and component star ratings, performance index, graduation rates, spending per pupil and teacher measures, for the district holding the largest… · Ohio school report cards
Full detail
School report card
- Components
- achievement 2 stars, progress 2 stars, gap closing 2 stars, early literacy 1 star, graduation 2 stars, college and career readiness 3 stars
- Achievement
- performance index 54.8% of ODE's maximum score for the year (the average of the top 2% of district scores, not the highest score possible) (score 60.2, 58.2 the year before)
- Graduation
- 88.8% of the class of 2024 graduated in four years; 63% of that class (graduates or not) showed college, career, workforce or military readiness
- Spending
- $13,309 per pupil in 2023-24 against $12,759 statewide
- Teachers
- average salary $66,856, 10 years of experience, 46% with a master's degree, 23.3% in their first years of teaching
- Enrollment
- 7,163 students in 2024-25
Three stars means the district meets state standards, five that it significantly exceeds them, one that it needs significant support. Achievement stars follow family income closely; the progress component (growth from year to year) is the fairer measure of teaching. Charter and private schools are not in the district figures.
Source: Ohio Department of Education and Workforce, 2024-2025 School Report Cards (district overview, achievement, expenditures per pupil and educator files), for the district where most of this ZIP's residents live · Ohio school report cards
Colleges
Under 3 milesClark State College · 1.8 miSpringfield · 4 campuses within 10 miles
Source: NCES IPEDS: 2024 institutional directory (269 active Ohio institutions with coordinates, less the administrative units and the colleges in data/ipeds/closed.json that have closed since), 12-month enrollment 2023-24, published tuition and… · NCES IPEDS
Full detail
Colleges
Clark State College is a public community or technical college with 6,711 students over the 2023-24 year; published tuition and fees $4,200 a year in state, $7,809 out of state; 25% of a 215-student entering class graduated (all programs, within 150% of normal time).
4 institutions within 10 miles, 24 within 25.
Next nearest: Wittenberg University (2 mi).
Universities, community colleges, career schools and private colleges all count; branch campuses appear only where IPEDS lists them separately. Graduation rates follow first-time full-time students for 150% of normal time.
Source: NCES IPEDS 2024 directory, 12-month enrollment 2023-24, tuition and fees 2023-24 and graduation rates for the 2017 entering cohort at four-year institutions and the 2020 cohort at two-year ones; straight-line miles from the ZIP's population-weighted center · NCES IPEDS
Local government
255 citiesSpringfield (city)75% of residents, then Springfield Township, Clark County
Source: ODOT municipal corporation and township boundaries by resident share of 2020 census blocks; Ohio EPA grants awarded in 2025 (OEPA_Achievements, MapServer layer 8); Auditor of State unauditable entities list · ODOT GIS · Auditor of State · Ohio EPA grants (OEPA_Achievements)
Full detail
Local government
- Springfield (city)75% of residentsCity
- Springfield Township, Clark County17% of residentsTownship
- Mad River Township, Clark County4% of residentsTownship
- Green Township, Clark County2% of residentsTownship
ZIP codes and municipal and township boundaries do not share boundaries, so this ZIP is split between them.
Source: ODOT municipal corporation and township boundaries · 2020 census blocks · Ohio EPA grants awarded in 2025 (OEPA_Achievements map service) · Auditor of State unauditable entities list · ODOT GIS · Auditor of State · Ohio EPA grants (OEPA_Achievements)
Representatives
OH-10 · Mike Turner (R)Senate 10 Kyle Koehler · House 74 Bernard Willis
Source: ODOT TIMS Boundaries US_House_District, Ohio_Senate_District and Ohio_House_District (fetched 2026-09-08) by resident share of 2020 census blocks; members from the U.S. House, Ohio Senate and Ohio House directories, September 2026 · U.S. House · Ohio Senate · Ohio House · ODOT GIS
Full detail
Who represents this ZIP
U.S. Senate: Bernie Moreno (R), Jon Husted (R)
- Mike Turner RU.S. House OH-10Dayton · since 2003 · site
- Kyle Koehler ROhio Senate 10Springfield · since 2024 · site
- Bernard Willis ROhio House 74 · 94%Springfield · since 2022 · site
- Levi Dean R 71 · 6%Xenia · since 2024 · site
District lines cut through this ZIP, so more than one member serves its residents; the share is by 2020 population.
Source: ODOT district boundaries · members from the U.S. House, Ohio Senate and Ohio House directories, September 2026 · U.S. House · Ohio Senate · Ohio House · ODOT GIS
Around here
Places in this ZIP
- Springfieldcity75% of residents
- Springfield Townshiptownship17% of residents
- Mad River Townshiptownship4% of residents
- Green Townshiptownship2% of residents
- Bethel Townshiptownship2% of residents
School districts
ZIP codes next door
The county
Clark County: 15 ZIP codes, 19 cities, villages and townships, 135,514 people. The county in numbers.
On the map
Infrastructure layers for this ZIP have not been compiled yet. Open this ZIP on the map to see what is drawn nearby.
Cite and data
Cite this page as:
Cracked Buckeye (Open Shower Co), "45506 · Springfield, Clark County", https://crackedbuckeye.com/zip/45506/, built 2026-09-16, accessed [date].
Machine-readable: /api/zip/45506.json (open JSON, CC BY 4.0 for the compilation; the underlying records keep their own terms) · How to cite · Report a correction · Built 2026-09-16