Water system
Lexington Village
EPA ID OH7002212 · Richland County · 4,825 people served · owned by a local government
Lexington Village treats its own water from Groundwater wells (3 wells).
The system's record
- Active wells
- 3
- Serves
- 4,825 people · Richland County
- EPA ID
- OH7002212
About this area's water
Did you know
- Lexington is named for Lexington, Massachusetts - founder Amariah Watson Jr. chose it out of respect for his father, who fought in the Revolutionary War that began there.
- The village's four water towers hold 1,750,000 gallons, roughly three to four days of the plant's 400,000-500,000 gallon daily output.
- Harry F. Smith, the local gas-power entrepreneur who helped build the village water system, is remembered as the 'Father of the Clear Fork Reservoir'; he also put up a steam-powered outdoor lighting system in 1894 and later sold his company to General Motors.
- The village seal reads 'Founded 1813,' a year later than the 1812 founding date usually cited - 1813 is the year Watson's water-powered sawmill went up on the Clear Fork.
History6
- 1812Founded by land speculator Amariah Watson Jr., who named it for Lexington, Massachusetts out of respect for his Revolutionary War veteran father. Note: the village's own seal reads 'Founded 1813.'
- 1813Watson built a water-powered sawmill on the Clear Fork River, which drew settlers and seeded the town's economy.
- 1839Lexington received official village status.
- 1894Local businessman Harry F. Smith, founder of Smith Gas Power Company, built what is described as the first steam-powered outdoor lighting system; he was also instrumental in developing Lexington's water system and is remembered as the 'Father of the Clear Fork Reservoir.'
- 1960-1970Population jumped from 1,311 to 2,972 (about 127%) as Mansfield-area suburban growth reached the village.
- 2023Village-wide water meter replacement: USG Water Solutions notified customers (July 2023) that meters at end of life would be replaced at no charge, installed by contractor National Metering Services, as part of a meter-reading system upgrade.
Treatment & pressure
How it is treated
Village-owned groundwater system. The 2024 CCR states Lexington draws from 3 groundwater wells within the village; the water plant at 152 Plymouth Street treats an average of 400,000 to 500,000 gallons per day; water is filtered through 2 greensand filters (the standard arrangement for iron and manganese removal) and treated with chlorine. The village has 4 water towers with combined storage of 1,750,000 gallons.
Source: lexingtonohio.uslexingtonohio.us
What it costs
$8.13 per 1,000 gallons
Typical household bill about $40 a month for water.
From the village's own Water & Sewer page (monthly billing): WATER $8.13 per 1,000 gallons. SEWER is a separate $8.82 per 1,000 gallons and must not be reported as a water rate.
Source: lexingtonohio.us
Water quality & impurities8
| Contaminant | Level | Limit | Year |
|---|---|---|---|
| Total trihalomethanes (TTHM) The CCR prints the MCL as '.080' - a units slip for 80 ppb. | 8.1 (range 8.1-13.4) ppb | 80 ppb MCL | 2024 |
| Haloacetic acids (HAA5) CCR prints the MCL as '.060' - a units slip for 60 ppb. Not detected above the reporting limit. | <6.0 ppb | 60 ppb MCL | 2024 |
| Total chlorine | 0.75 (range 0.5-1.5) mg/L | 4 mg/L MRDL | 2024 |
| Barium Monitored less than annually under Ohio EPA rules; most recent result is from 2022. | 0.064 mg/L | 2 mg/L MCL | 2022 |
| Fluoride Low level consistent with naturally occurring fluoride. Range printed as 0.12. | 0.141 mg/L | 4 mg/L MCL | 2022 |
| Asbestos Not detected; source would be decay of asbestos cement water mains. | <0.18 MFL | 7 MFL MCL | 2022 |
| Lead 0 of 20 samples above the action level. | 1.6 (90th percentile) ppb | 15 ppb action level | 2024 |
| Copper 0 of 20 samples above the action level. | 0.120 (90th percentile) ppm | 1.3 ppm action level | 2024 |
Source: lexingtonohio.us
EPA compliance record
Lead at the tap: 90th-percentile result 0 ppb in 2025 (action level 15 ppb).
EPA record: no health-based violations since 2015.
5 violations of any kind logged since 2020: 5 for a report, record or notice that was missing, late or incomplete (the yearly water quality report, a public notice, lead line records).
Projects & plans1
Recent and current work
- Village-wide water meter replacement and meter-reading system upgrade · 2023 · completed
Run by USG Water Solutions with contractor National Metering Services; letter to residents dated July 2023 states there was no charge to customers for the meter replacement and installation.
Source: lexingtonohio.uslexingtonohio.us
Supply stress
Low. The Ohio EPA source water assessment quoted in the 2024 CCR finds that Lexington's drinking water source has a LOW susceptibility to contamination, based on a moderately thick protective clay layer overlying the aquifer, the significant depth of the aquifer (44 feet below ground surface), and no evidence that groundwater has been impacted by significant levels of chemical contaminants from human activity. The plant runs at 400,000-500,000 gallons per day against 1,750,000 gallons of tower storage.
Source: lexingtonohio.us
Sewers
Sanitary
Village-operated and village-billed: sewer is charged at $8.82 per 1,000 gallons on the same monthly bill as water, with a $1,400 sewer connection fee and a $400 sewer inspection fee.
Storm
The village bills a storm water charge of $2.16 per Equivalent Residential Unit, so storm drainage is funded as a distinct utility line item rather than through the sanitary rate. Lexington is also the one village explicitly brought inside Richland County's Stormwater Management and Sediment Control Regulations for earth-disturbing and construction projects.
Source: lexingtonohio.uslexingtonohio.us
Serves
Main water supplier in 1 ZIP code
- 44904 · Lexington and Mansfield31% of residents
Population-weighted resident shares; a ZIP code can have more than one system on record. Recomputed from each ZIP's own system list, not from the map's cached footprint.
Buys from · Sells to
Lexington Village does not buy water from another system on record; it treats its own source water.
No other system is on record buying water from Lexington Village.
What the records show about Lexington Village
Who runs it
EPA's record describes Lexington Village as owned by a local government. It has 1,826 service connections and serves 4,825 people.
EPA classes it as a community water system, one that serves the same residents all year.
Its office telephone on EPA's record is 419-884-0765.
Source: EPA Safe Drinking Water Information System (SDWIS), water system record.
How the water is treated
EPA's treatment table registers these steps for Lexington Village: chlorine disinfection and iron and manganese removal.
The list is what each system registered with EPA for treatment plants EPA still shows as active, and it can lag a plant upgrade.
Source: EPA Safe Drinking Water Information System (SDWIS) treatment table (EPA Envirofacts, pulled September 2026).
Violations
EPA's record shows no health-based violations for Lexington Village since 2015.
EPA logs 5 violations of any kind since 2020: 5 for a report, record or notice that was missing, late or incomplete (the yearly water quality report, a public notice, lead line records).
Source: EPA Safe Drinking Water Information System (SDWIS) violation records: health-based violations with compliance periods beginning in 2015 or later, all violations from 2020 or later (EPA Envirofacts, pulled November 2026).
Lead and copper at the tap
For the sampling period ending December 2025, EPA's record lists the 90th-percentile lead result at Lexington Village as 0 ppb, under both the current 15 ppb action level and the 10 ppb level that applies from 2027. EPA records a result below the lab's reporting level as 0, so this is the result reported, not proof that no home sampled had lead.
The highest result on file is 6.7 ppb, in the period ending December 2016.
EPA has 9 sampling periods on file for Lexington Village since 2016, the first ending in 2016; no period was above 10 ppb.
Every water system has to inventory its service lines, the pipes from the main to each building. In the inventory Lexington Village sent EPA, 2,006 lines are counted.
| Material | Lines |
|---|---|
| Lead | 0 |
| Galvanized, needing replacement | 0 |
| Unknown material | 1,371 |
| Not lead | 635 |
| All lines | 2,006 |
Systems sample taps in the homes most likely to have lead pipes or solder. The 90th-percentile result is the level nine in ten of the sampled homes were at or below. Lead comes mostly from service lines and house plumbing, not the source water, so a low result for the system does not clear an old house.
EPA's dashboard status for this inventory: reported all required service line types.
Source: EPA Safe Drinking Water Information System (SDWIS) lead and copper 90th-percentile results (EPA Envirofacts), sampling periods ending 2016 or later; EPA's service line inventory dashboard, Ohio's 2026 Q2 submission.
PFAS
EPA's fifth national round of testing (UCMR 5) took 3 samples of the water entering the pipes of Lexington Village in 2023 to 2024 and measured 29 PFAS. EPA's UCMR 5 file shows no PFAS detected, PFOA and PFOS (federal limit 4 ng/L each) among them.
Ohio EPA's own statewide sampling tested 1 plant of Lexington Village (latest sample June 2020). Not one of the six PFAS tested (PFOA, PFOS, PFHxS, PFNA, GenX and PFBS) was detected.
Ohio EPA's current sampling status map lists 1 plant of Lexington Village as sampled, most recently February 2026.
PFAS are the 'forever chemicals' from firefighting foam, plating shops and non-stick coatings. Results are for water leaving the plant, not your tap.
Source: EPA UCMR 5 occurrence data (final release, August 2026); Ohio EPA statewide PFAS sampling, 2019 to 2021, and its sampling status map.
Disinfection byproducts
Chlorine that disinfects water also reacts with organic matter to form byproducts. Two groups have federal limits: total trihalomethanes (TTHM, 80 µg/L) and five haloacetic acids (HAA5, 60 µg/L), judged on running yearly averages at each sampling site.
For TTHM, the average of Lexington Village's samples in 2019, the last year it was sampled, was 12.8 µg/L. The worst yearly average was 18.4 µg/L and the highest single sample was 20.7 µg/L, from 14 samples taken from 2013 to 2019.
For HAA5, the average in the last year sampled was 0 µg/L. The worst yearly average was 6.8 µg/L and the highest single sample was 8.6 µg/L, from 14 samples.
| Byproduct | Limit | Latest yearly average | Worst yearly average | Highest sample | Samples |
|---|---|---|---|---|---|
| TTHM | 80 µg/L | 12.8 µg/L (2019) | 18.4 µg/L | 20.7 µg/L | 14 |
| HAA5 | 60 µg/L | 0 µg/L | 6.8 µg/L | 8.6 µg/L | 14 |
A yearly average of 0 means nothing was detected in that year's samples. EPA's file stops at 2019; Ohio EPA's Drinking Water Watch has newer results.
Source: EPA Six-Year Review 4 compliance monitoring data, 2012 to 2019, distribution-system samples (non-detects counted as zero).
Nitrate, arsenic and radioactivity
Nitrate was not detected in 8 samples through 2019 (limit 10 mg/L as nitrogen; above 10 is unsafe for infants).
Arsenic: the highest of 3 samples was 6.2 µg/L (limit 10); detections averaged 6.2; none over the limit.
| Contaminant | Samples | Highest result | Limit | Samples over limit |
|---|---|---|---|---|
| Nitrate (as nitrogen) | 8 | not detected | 10 mg/L | 0 |
| Arsenic | 3 | 6.2 µg/L | 10 µg/L | 0 |
Measured in finished water: at the plant's entry points and in the distribution system; raw well and intake samples are left out. Non-detects count as zero.
Source: EPA Six-Year Review 4 compliance monitoring data, 2012 to 2019, finished water.
Solvents and fuels
EPA's file holds results for all six solvent and fuel compounds it checked. Benzene, carbon tetrachloride, 1,2-dichloroethane, trichloroethylene, tetrachloroethylene, and vinyl chloride were not detected in 3 samples each.
| Compound | Limit | Samples | Detected in | Highest result | Samples over limit |
|---|---|---|---|---|---|
| Benzene | 5 µg/L | 3 | 0 of 3 | not detected | 0 |
| Carbon tetrachloride | 5 µg/L | 3 | 0 of 3 | not detected | 0 |
| 1,2-dichloroethane | 5 µg/L | 3 | 0 of 3 | not detected | 0 |
| Trichloroethylene (TCE) | 5 µg/L | 3 | 0 of 3 | not detected | 0 |
| Tetrachloroethylene (PCE) | 5 µg/L | 3 | 0 of 3 | not detected | 0 |
| Vinyl chloride | 2 µg/L | 3 | 0 of 3 | not detected | 0 |
"Not detected" means the lab's result was below what its method can measure, not that the compound is absent. Non-detects count as zero in the highest-result column.
Source: EPA Six-Year Review 4 compliance monitoring data, 2012 to 2019, finished water.
Farm chemicals and metals
EPA's file holds results for 8 of the nine herbicides and metals it checked. Detected: barium in 3 of 3 samples, highest 190 µg/L (limit 2,000). Not detected: atrazine in 2 samples, alachlor in 2 samples, chromium in 3 samples, cadmium in 3 samples, mercury in 3 samples, selenium in 3 samples, thallium in 3 samples.
| Substance | Kind | Limit | Samples | Detected in | Highest result | Samples over limit |
|---|---|---|---|---|---|---|
| Atrazine | Farm chemical | 3 µg/L | 2 | 0 of 2 | not detected | 0 |
| Alachlor | Farm chemical | 2 µg/L | 2 | 0 of 2 | not detected | 0 |
| Chromium | Metal | 100 µg/L | 3 | 0 of 3 | not detected | 0 |
| Cadmium | Metal | 5 µg/L | 3 | 0 of 3 | not detected | 0 |
| Barium | Metal | 2,000 µg/L | 3 | 3 of 3 | 190 µg/L | 0 |
| Mercury | Metal | 2 µg/L | 3 | 0 of 3 | not detected | 0 |
| Selenium | Metal | 50 µg/L | 3 | 0 of 3 | not detected | 0 |
| Thallium | Metal | 2 µg/L | 3 | 0 of 3 | not detected | 0 |
Non-detects count as zero in the highest-result column.
Source: EPA Six-Year Review 4 compliance monitoring data, 2012 to 2019, finished water.
Bacteria in the pipes
From 2012 to 2019, 0 of 490 routine total coliform samples taken in the distribution system at Lexington Village tested positive (0%); in 2019, the last year on file, 0 of 63 did.
A positive coliform test is a warning sign, not a violation by itself. E. coli is a sign that human or animal waste may have reached the water. Coliform counts are routine samples only; E. coli counts include repeat samples.
Source: EPA Six-Year Review 4 compliance monitoring data, 2012 to 2019, distribution-system presence/absence tests for total coliform and E. coli.
Fluoride
The Ohio Department of Health's report to the CDC (My Water's Fluoride) says Lexington Village has fluoride from natural sources, but at a level below what is recommended for preventing tooth decay, and does not adjust it. The level it reports is 0.14 mg/L.
EPA's treatment table lists no fluoridation step at Lexington Village.
Measured fluoride: 0.18 mg/L on average at the plant's entry points in 2019 (too little to protect teeth); samples ran from 0.12 to 0.18 mg/L across 3 samples in 2012 to 2019.
The recommended level for preventing tooth decay is 0.7 mg/L; the federal limit is 4 mg/L. The treatment list is what each system registered with EPA and can lag a plant upgrade.
Source: CDC My Water's Fluoride (fluoridation status as reported by the Ohio Department of Health, fetched September 2026); EPA Safe Drinking Water Information System (SDWIS) treatment table; EPA Six-Year Review 4 compliance monitoring data, 2012 to 2019, entry-point fluoride samples.
Lithium
Lithium was not detected in 2 UCMR 5 samples at Lexington Village, last sampled in 2023 (the method reports from 9 µg/L).
Lithium is not regulated. EPA's draft health reference level is 10 µg/L, and it occurs naturally in deep groundwater, so well systems in the northwest run highest.
Source: EPA UCMR 5 occurrence data (final release, August 2026), samples from 2023 to 2025.
Water and sewer bills
Ohio EPA's 2023 rate survey puts the water bill at Lexington Village for a household using 5,000 gallons a month at $548 a year, about $46 a month.
The sewer bill in the same survey is $548 a year at 5,000 gallons a month.
| Use | Water, per year | Sewer, per year |
|---|---|---|
| 2,500 gallons a month | $330 | $330 |
| 5,000 gallons a month | $548 | $548 |
| 8,000 gallons a month | $808 | $808 |
The survey lists it as “Lexington”. These are inside-city rates and annual bills at the use shown.
Source: Ohio EPA 2023 Sewer and Water Rate Survey (Ohio State University, May 2025).
How well the service area is mapped
The service area drawn on the map for Lexington Village comes from the utility's own map.
Counting the people who live in the ZIP codes it overlaps, this atlas estimates 4,455 residents are inside the boundary, 92% of the 4,825 people Lexington Village reports serving.
The resident count is an estimate from 2020 Census ZIP-code populations, not a count of customers.
Source: EPA Service Area Boundaries; resident estimate by this atlas from ZIP-code overlap.
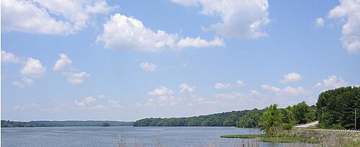
Photograph
On the map
Show this system's territory on the map — 1 ZIP code in all.
Sources
U.S. EPA SDWIS and Community Water System Service Area Boundaries (v3, 2026), Ohio EPA primacy data, 2020 census blocks: the system serving most residents, traced through purchases to the treating utility; Ohio EPA 2023 Sewer and Water Rate Survey (Ohio State, May 2025) for household bills; Ohio EPA DEFA loan awards since 2016 for the loans paragraph · EPA SDWIS · EPA service area boundaries · Ohio EPA drinking water · Ohio EPA rate survey
EPA's own record for this system: Enforcement and Compliance History report for OH7002212 (EPA ECHO).
Notable facts: en.wikipedia.org, lexingtonohio.us, lexingtonohio.us
History: en.wikipedia.org, lexingtonohio.us, lexingtonohio.us
Water quality: lexingtonohio.us
Capital projects: lexingtonohio.us, lexingtonohio.us
Rates: lexingtonohio.us
Sewers: lexingtonohio.us, lexingtonohio.us
Treatment: lexingtonohio.us, lexingtonohio.us
Supply stress: lexingtonohio.us