Water system
Zanesville
EPA ID OH6002712 · Muskingum County · 29,381 people served
Zanesville treats its own water from Muskingum River valley aquifer (wells).
The system's record
- Aquifer
- Muskingum River valley (buried sand/gravel) aquifer
- Water bodies
- Muskingum River
- Active wells
- 13
- Serves
- 29,381 people · Muskingum County
- EPA ID
- OH6002712
About this area's water
Did you know
- The city's well field is one half of a Superfund site: up to 121 drums of TCE were dropped down a 40-foot brick-lined well on the factory property across the river in the early 1970s, and U.S. EPA stumbled on the…
- That factory property has been in industrial use since 1893, when the American Encaustic Tiling Company built there.
- Zanesville's 2011 plant pushes its water through eight 12-foot GreensandPlus filters to strip out iron and manganese; the $16 million plant was paid for with federal stimulus money.
- The interconnections with the Muskingum County Water Department are strictly emergency backups — the city's 2023 report says they weren't used at all that year.
- Zanesville bills water by the cubic foot, not the gallon: $6.50 per 100 cubic feet works out to $8.69 per 1,000 gallons.
History6
- 1893The neighboring west-bank property begins its life as a factory when the American Encaustic Tiling Company builds there; it later passes to Essex and then United Technologies, and manufacturing…
- 1970sUp to 121 drums of trichloroethylene solvent are placed inside a 40-foot brick-lined dug well on the plant property across the Muskingum River from the city well field.
- 1981U.S. EPA finds TCE contamination at the City of Zanesville's water supply well field during a random spot check for volatile organic compounds.
- 1983An interim groundwater extraction and treatment system is installed in July and about 120 drums are removed; the Zanesville Well Field site is added to the National Priorities List in September.
- 1987A 7.5 MGD water treatment plant is placed in service.
- 1991The Record of Decision selecting the Superfund remedy — groundwater capture and treatment plus soil treatment — is signed in September.
Treatment & pressure
How it is treated
Twelve wells in the Muskingum River Buried Valley Aquifer along Lewis Drive (S.R. 666) at Riverside Park feed the City of Zanesville Water Division plant at 14 Buckeye Drive. The $16 million, 10 MGD plant that came online at the end of 2011 replaced a 7.5 MGD plant dating to 1987; it uses eight…
Source: coz.orgcoz.orgwateronline.com
Water pressure
Not published. The city reports six storage tanks totaling 8.5 million gallons and 194 miles of main but no pressure zones or psi figures.
Source: coz.org
What it costs
$8.69 per 1,000 gallons
Typical household bill about $34 a month for water.
City rate sheet: residential inside the city pays a $12.50 monthly minimum covering the first 200 cubic feet, then $6.50 per 100 cubic feet for the next 4,600 cf and $6.00 per 100…
Source: coz.org
Water quality & impurities10
| Contaminant | Level | Limit | Year |
|---|---|---|---|
| Total trihalomethanes (TTHM) Highest level detected; range 34.7-37.2 ppb. | 36 ppb | 80 | 2023 |
| Haloacetic acids (HAA5) Range 8.1-19.5 ppb. | 14 ppb | 60 | 2023 |
| Chlorine Range 1.0-1.1 ppm. | 1.1 ppm | MRDL 4 | 2023 |
| Nitrate (as nitrogen) Reported as the highest level detected; the CCR's own range column reads 0.516-0.52 ppm. | 1 ppm | 10 | 2023 |
| Fluoride Sampled 6/8/2021; monitored less than annually. | 0.85 ppm | 4.0 | 2021 |
| Barium Sampled 6/8/2021. | 0.0439 ppm | 2 | 2021 |
| Cyanide Sampled 6/8/2021. | 1 ppb | 200 | 2021 |
| Nitrite (as nitrogen) Sampled 6/8/2021. | 0.02 ppm | 1 | 2021 |
| Lead (90th percentile) No sites over the action level. The CCR's table mislabels the lead units as ppm; the value is 3 ppb. | 3 ppb | action level 15… | 2022 |
| Copper (90th percentile) No sites over the action level. | 0.345 ppm | action level… | 2022 |
Source: coz.org
EPA compliance record
Lead at the tap: 90th-percentile result 0.9 ppb in 2025 (action level 15 ppb).
EPA record: no health-based violations since 2015.
Projects & plans9
Recent and current work
- New 10 MGD water treatment plant, 14 Buckeye Drive · $16 million · 2011 · completed
Eight Hungerford & Terry GreensandPlus filters plus two 500,000-gallon raw water tanks and two on-site laboratories; federally stimulus-funded; replaced a 7.5… - Water line replacements on Military Road, Cliffwood, Maple and Woodlawn avenues · 2023 · completed
Reported in the city's 2023 CCR along with numerous hydrant and service line installations and repairs; no cost published. - Sewer separation at CSO racks R6 and R8-R11 with Y-Bridge pump station force main improvements · $5.8 million · 2024 · completed
The $5.8 million figure is the city's nomination for 0% CSO discount loans through Ohio's Water Pollution Control Loan Fund, not a final construction… - Linden Avenue lift station rehabilitation · 2024 · completed
Pumps replaced to maintain existing design capacity; counted among the LTCP Update's Early Action projects, which total $10,994,000 in 2021 dollars.
Source: coz.orgwateronline.comdam.assets.ohio.gov
Planned or needed
- Water line improvements on Dresden Road, W. Country Club and Center Drive · 2024 · planned
Listed as scheduled in the city's 2023 CCR; no cost published and no completion notice found. - CSO Long-Term Control Plan Update selected alternative · $40 million · 2025 · planned
AECOM plan for the city dated March 2025 and posted by Ohio EPA: $40.04 million in 2021 dollars over a three-phase, 20-year schedule, cutting typical-year… - Wastewater treatment plant upgrades under the LTCP Update · $15 million · planned
Restore peak primary treatment capacity to 36 MGD and peak secondary to 27 MGD by removing hydraulic bottlenecks; current wet weather capacity is 25 MGD. - In-line and off-line CSO storage at racks R3 and R21 · $12 million · planned
Oversized gravity sewer for in-line storage at R3; a storage array plus a 1 MGD pump station at R21. - Zanesville Well Field Superfund: PFAS sampling and updated environmental covenants · 2026 · needed
Identified as needed actions in the sixth five-year review completed May 11, 2026; long-term groundwater monitoring and operation of the remedy continue.
Supply stress
Ohio EPA's source water assessment rates Zanesville's supply as highly susceptible to contamination: there is no protective clay layer over the aquifer, the aquifer is less than 20 feet below ground surface, man-made contaminants are already present in it, and significant potential contaminant sources sit in the protection area. The well…
Source: coz.orgcumulis.epa.govcoz.org
Sewers
Sanitary
The city runs its own wastewater plant on Moxahala Avenue, discharging to the Muskingum River, with an average daily design flow around 11 MGD and a current wet weather capacity of 25 MGD. Much of the older city is served by a combined system; about a dozen CSO outfalls (the city calls them 'racks') remain active, discharging an…
Storm
Zanesville runs a stormwater utility. The 2024 residential fee is $5.13 a month, equal to one Equivalent Residential Unit; commercial accounts are charged one ERU for every 2,300 square feet of impervious surface, measured on the utility's interactive map.
Source: dam.assets.ohio.govcoz.org
Sourcesverified
Compiled from the utility's own reports and public records, then independently re-checked against primary sources.
Main supplier in 1 ZIP code
Serves
Main water supplier in 1 ZIP code
- 43701 · Zanesville49% of residents
Population-weighted resident shares; a ZIP code can have more than one system on record. Recomputed from each ZIP's own system list, not from the map's cached footprint.
Buys from · Sells to
Zanesville does not buy water from another system on record; it treats its own source water.
No other system is on record buying water from Zanesville.
What the records show about Zanesville
Who runs it
EPA's record says Zanesville has 12,286 service connections and serves 29,381 people.
EPA classes it as a community water system, one that serves the same residents all year.
EPA's record says it has substantially implemented source water protection under Ohio's program, dating the program from 2023. Its office telephone on EPA's record is 740-617-4908.
Source: EPA Safe Drinking Water Information System (SDWIS), water system record.
How the water is treated
EPA's treatment table registers these steps for Zanesville: corrosion control, chlorine disinfection, iron and manganese removal, and fluoridation.
The list is what each system registered with EPA for treatment plants EPA still shows as active, and it can lag a plant upgrade.
Source: EPA Safe Drinking Water Information System (SDWIS) treatment table (EPA Envirofacts, pulled September 2026).
Violations
EPA's record shows no health-based violations for Zanesville since 2015.
EPA logs no violations of any kind for Zanesville since 2020.
Source: EPA Safe Drinking Water Information System (SDWIS) violation records: health-based violations with compliance periods beginning in 2015 or later, all violations from 2020 or later (EPA Envirofacts, pulled September 2026).
Lead and copper at the tap
In the sampling period ending December 2025, the 90th-percentile lead result at Zanesville was 0.9 ppb, under both the current 15 ppb action level and the 10 ppb level that applies from 2027.
The highest result on file is 3 ppb, in the period ending December 2022.
EPA has 5 sampling periods on file for Zanesville since 2016, the first ending in 2017; no period was above 10 ppb.
Every water system has to inventory its service lines, the pipes from the main to each building. In the inventory Zanesville sent EPA, 11,593 lines are counted.
| Material | Lines |
|---|---|
| Lead | 6 |
| Galvanized, needing replacement | 24 |
| Unknown material | 11,540 |
| Not lead | 23 |
| All lines | 11,593 |
Systems sample taps in the homes most likely to have lead pipes or solder. The 90th-percentile result is the level nine in ten of the sampled homes were at or below. Lead comes mostly from service lines and house plumbing, not the source water, so a low result for the system does not clear an old house.
EPA's dashboard status for this inventory: reported all required service line types.
Source: EPA Safe Drinking Water Information System (SDWIS) lead and copper 90th-percentile results (EPA Envirofacts), sampling periods ending 2016 or later; EPA's service line inventory dashboard, Ohio's 2026 Q2 submission.
PFAS
EPA's fifth national round of testing (UCMR 5) took 2 samples of the water entering the pipes of Zanesville in 2023 and measured 29 PFAS.
PFOA and PFOS were not detected, against a federal limit of 4 ng/L each.
The highest PFAS results were 6:2 FTS 20.1 ng/L and PFBS 3.1 ng/L.
Ohio EPA's own statewide sampling tested 1 plant of Zanesville (latest sample August 2020). Not one of the six PFAS tested (PFOA, PFOS, PFHxS, PFNA, GenX and PFBS) was detected.
Ohio EPA's current sampling status map lists 1 plant of Zanesville as sampled, most recently August 2026.
| Compound | Highest result | Federal limit |
|---|---|---|
| PFOA | not detected | 4 ng/L |
| PFOS | not detected | 4 ng/L |
PFAS are the 'forever chemicals' from firefighting foam, plating shops and non-stick coatings. Results are for water leaving the plant, not your tap.
Source: EPA UCMR 5 occurrence data (final release, August 2026); Ohio EPA statewide PFAS sampling, 2019 to 2021, and its sampling status map.
Disinfection byproducts
Chlorine that disinfects water also reacts with organic matter to form byproducts. Two groups have federal limits: total trihalomethanes (TTHM, 80 µg/L) and five haloacetic acids (HAA5, 60 µg/L), judged on running yearly averages at each sampling site.
For TTHM, the average of Zanesville's samples in 2019, the last year it was sampled, was 37 µg/L. The worst yearly average was 73.6 µg/L and the highest single sample was 73.6 µg/L, from 95 samples taken from 2012 to 2019.
For HAA5, the average in the last year sampled was 12.1 µg/L. The worst yearly average was 20.9 µg/L and the highest single sample was 30.9 µg/L, from 93 samples.
| Byproduct | Limit | Latest yearly average | Worst yearly average | Highest sample | Samples |
|---|---|---|---|---|---|
| TTHM | 80 µg/L | 37 µg/L (2019) | 73.6 µg/L | 73.6 µg/L | 95 |
| HAA5 | 60 µg/L | 12.1 µg/L | 20.9 µg/L | 30.9 µg/L | 93 |
A yearly average of 0 means nothing was detected in that year's samples. EPA's file stops at 2019; Ohio EPA's Drinking Water Watch has newer results.
Source: EPA Six-Year Review 4 compliance monitoring data, 2012 to 2019, distribution-system samples (non-detects counted as zero).
Nitrate, arsenic and radioactivity
Nitrate: the highest of 8 samples was 0.9 mg/L (as nitrogen) in 2014; in 2019, the last year sampled, the highest was 0.7 mg/L. No sample was over the limit of 10 mg/L. Nitrate above 10 is unsafe for infants.
Arsenic was not detected in 3 samples (limit 10 µg/L).
| Contaminant | Samples | Highest result | Limit | Samples over limit |
|---|---|---|---|---|
| Nitrate (as nitrogen) | 8 | 0.9 mg/L | 10 mg/L | 0 |
| Arsenic | 3 | not detected | 10 µg/L | 0 |
Measured in finished water: at the plant's entry points and in the distribution system; raw well and intake samples are left out. Non-detects count as zero.
Source: EPA Six-Year Review 4 compliance monitoring data, 2012 to 2019, finished water.
Solvents and fuels
EPA's file holds results for all six solvent and fuel compounds it checked. Benzene, carbon tetrachloride, 1,2-dichloroethane, trichloroethylene, tetrachloroethylene, and vinyl chloride were not detected in 3 samples each.
| Compound | Limit | Samples | Detected in | Highest result | Samples over limit |
|---|---|---|---|---|---|
| Benzene | 5 µg/L | 3 | 0 of 3 | not detected | 0 |
| Carbon tetrachloride | 5 µg/L | 3 | 0 of 3 | not detected | 0 |
| 1,2-dichloroethane | 5 µg/L | 3 | 0 of 3 | not detected | 0 |
| Trichloroethylene (TCE) | 5 µg/L | 3 | 0 of 3 | not detected | 0 |
| Tetrachloroethylene (PCE) | 5 µg/L | 3 | 0 of 3 | not detected | 0 |
| Vinyl chloride | 2 µg/L | 3 | 0 of 3 | not detected | 0 |
"Not detected" means the lab's result was below what its method can measure, not that the compound is absent. Non-detects count as zero in the highest-result column.
Source: EPA Six-Year Review 4 compliance monitoring data, 2012 to 2019, finished water.
Farm chemicals and metals
EPA's file holds results for 8 of the nine herbicides and metals it checked. Detected: barium in 3 of 3 samples, highest 53.9 µg/L (limit 2,000). Not detected: atrazine in 2 samples, alachlor in 2 samples, chromium in 3 samples, cadmium in 3 samples, mercury in 3 samples, selenium in 3 samples, thallium in 3 samples.
| Substance | Kind | Limit | Samples | Detected in | Highest result | Samples over limit |
|---|---|---|---|---|---|---|
| Atrazine | Farm chemical | 3 µg/L | 2 | 0 of 2 | not detected | 0 |
| Alachlor | Farm chemical | 2 µg/L | 2 | 0 of 2 | not detected | 0 |
| Chromium | Metal | 100 µg/L | 3 | 0 of 3 | not detected | 0 |
| Cadmium | Metal | 5 µg/L | 3 | 0 of 3 | not detected | 0 |
| Barium | Metal | 2,000 µg/L | 3 | 3 of 3 | 53.9 µg/L | 0 |
| Mercury | Metal | 2 µg/L | 3 | 0 of 3 | not detected | 0 |
| Selenium | Metal | 50 µg/L | 3 | 0 of 3 | not detected | 0 |
| Thallium | Metal | 2 µg/L | 3 | 0 of 3 | not detected | 0 |
Non-detects count as zero in the highest-result column.
Source: EPA Six-Year Review 4 compliance monitoring data, 2012 to 2019, finished water.
Bacteria in the pipes
From 2012 to 2019, 11 of 3,173 routine total coliform samples taken in the distribution system at Zanesville tested positive (0.35%); in 2019, the last year on file, 2 of 384 did. E. coli was never found in the 11 samples tested for it.
A positive coliform test is a warning sign, not a violation by itself. E. coli is a sign that human or animal waste may have reached the water. Coliform counts are routine samples only; E. coli counts include repeat samples.
Source: EPA Six-Year Review 4 compliance monitoring data, 2012 to 2019, distribution-system presence/absence tests for total coliform and E. coli.
Fluoride
The Ohio Department of Health's report to the CDC (My Water's Fluoride) says Zanesville adjusts the fluoride level to the recommended level for preventing tooth decay.
EPA's treatment table lists fluoridation among the steps at Zanesville.
Measured fluoride: 1 mg/L on average at the plant's entry points in 2018 (in the range dentists aim for); samples ran from 0.93 to 1 mg/L across 3 samples in 2012 to 2019.
The recommended level for preventing tooth decay is 0.7 mg/L; the federal limit is 4 mg/L. The treatment list is what each system registered with EPA and can lag a plant upgrade.
Source: CDC My Water's Fluoride (fluoridation status as reported by the Ohio Department of Health, fetched September 2026); EPA Safe Drinking Water Information System (SDWIS) treatment table; EPA Six-Year Review 4 compliance monitoring data, 2012 to 2019, entry-point fluoride samples.
Lithium
Lithium was not detected in 2 UCMR 5 samples at Zanesville, last sampled in 2023 (the method reports from 9 µg/L).
Lithium is not regulated. EPA's draft health reference level is 10 µg/L, and it occurs naturally in deep groundwater, so well systems in the northwest run highest.
Source: EPA UCMR 5 occurrence data (final release, August 2026), samples from 2023 to 2025.
Water and sewer bills
Ohio EPA's 2023 rate survey puts the water bill at Zanesville for a household using 5,000 gallons a month at $515 a year, about $43 a month.
The sewer bill in the same survey is $554 a year at 5,000 gallons a month.
| Use | Water, per year | Sewer, per year |
|---|---|---|
| 2,500 gallons a month | $255 | $383 |
| 5,000 gallons a month | $515 | $554 |
| 8,000 gallons a month | $828 | $758 |
The survey lists it as “Zanesville”. These are inside-city rates and annual bills at the use shown.
Source: Ohio EPA 2023 Sewer and Water Rate Survey (Ohio State University, May 2025).
How well the service area is mapped
The service area drawn on the map for Zanesville comes from the utility's own map.
Counting the people who live in the ZIP codes it overlaps, this atlas estimates 27,398 residents are inside the boundary, 93% of the 29,381 people Zanesville reports serving.
The resident count is an estimate from 2020 Census ZIP-code populations, not a count of customers.
Source: EPA Service Area Boundaries; resident estimate by this atlas from ZIP-code overlap.
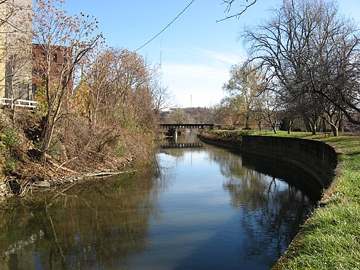
Photograph
On the map
Show this system's territory on the map — 1 ZIP code in all.
Sources
U.S. EPA SDWIS and Community Water System Service Area Boundaries (v3, 2026), Ohio EPA primacy data, 2020 census blocks: the system serving most residents, traced through purchases to the treating utility; Ohio EPA 2023 Sewer and Water Rate Survey (Ohio State, May 2025) for household bills; Ohio EPA DEFA loan awards since 2016 for the loans paragraph · EPA SDWIS · EPA service area boundaries · Ohio EPA drinking water · Ohio EPA rate survey
EPA's own record for this system: Enforcement and Compliance History report for OH6002712 (EPA ECHO).
Zanesville's own pages: softprowatersystems.com, cumulis.epa.gov
Notable facts: semspub.epa.gov, cumulis.epa.gov, wateronline.com, coz.org
History: coz.org, semspub.epa.gov, cumulis.epa.gov, cumulis.epa.gov
Water quality: coz.org
Planned work: coz.org, dam.assets.ohio.gov, cumulis.epa.gov, epa.gov
Water pressure: coz.org
Capital projects: coz.org, wateronline.com, dam.assets.ohio.gov
Rates: coz.org
Sewers: dam.assets.ohio.gov, coz.org
Treatment: coz.org, coz.org, wateronline.com
Supply stress: coz.org, cumulis.epa.gov, coz.org
