Water system
Canfield City
EPA ID OH5000503 · Mahoning County · 7,706 people served · owned by a local government
Canfield City buys its water from Youngstown City.
The system's record
- Water bodies
- Meander Creek Reservoir, Berlin Reservoir
- Raw intakes
- Meander Creek Reservoir
Berlin Reservoir - EPA ID
- OH7801811
About this area's water
Did you know
- Canfield owns no treatment plant, no reservoir and no wells - it buys every gallon already finished from the Mahoning Valley Sanitary District and simply pipes it to customers.
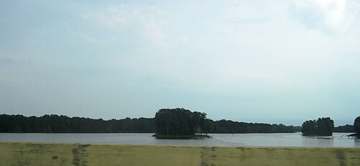
- The reservoir behind Canfield's tap is big: Meander Creek Reservoir is seven miles long, covers 2,010 acres, has 40 miles of shoreline and holds about 11 billion gallons.
- The district that supplies Canfield was formed in 1926 and has been delivering water since 1932.
- In Canfield's 2025 lead sampling, one tap out of 40 came back above the 15 ppb action level in each of two monitoring rounds - 35.9 ppb and 35.3 ppb - even though the citywide 90th percentile was non-detect.
- Canfield charges its outside-city customers about 20% more per 1,000 gallons than residents: $16.64 versus $13.88.
History5
- 1926The Mahoning Valley Sanitary District, Canfield's wholesale supplier, was formed; it began delivering water to its member cities in 1932.
- 2009Ohio EPA completed the source water assessment for the MVSD system that supplies Canfield; it was last updated in 2026.
- 2018A water main break on Hickory Hollow (January 25, 2018) triggered a boil-water advisory for affected residents, lifted at 3:00 p.m. on January 27, 2018.
- 2025In two rounds of lead and copper tap sampling, one site out of 40 exceeded the 15 ppb lead action level in each round (35.9 ppb and 35.3 ppb); the 90th percentile stayed non-detect, so there was no…
- 2025A new city water rate schedule (Section 927.01) took effect October 1, 2025.
Treatment & pressure
How it is treated
Canfield treats no water of its own. It buys finished water wholesale from the Mahoning Valley Sanitary District (branded Meander Water), based in Mineral Ridge, which draws surface water from Meander Creek Reservoir; Canfield distributes it through city mains and adds no treatment. Canfield's 2025…
Source: canfield.govcanfield.govmeanderwater.org
Water pressure
Not published. Canfield's 2025 CCR directs residents with questions about distribution, service or pressure to John Rapp or Anthony Snovak at the Public Works Department, (330)…
Source: canfield.gov
What it costs
$13.88 per 1,000 gallons
Typical household bill about $69 a month for water.
Rate schedule 927.01, effective October 1, 2025. In-city metered water: $13.88 per 1,000 gallons for the first 100,000 gallons in any quarter, $11.21 per 1,000 gallons above that.…
Water quality & impurities10
| Contaminant | Level | Limit | Year |
|---|---|---|---|
| Chlorine Range 1.4-3.2. Water additive used to control microbes. | 2.03 ppm | 4 (MRDL) | 2025 |
| Fluoride Range 0.85-1.10. | 1.00 ppm | 4 | 2025 |
| Haloacetic Acids (HAA5) Range 20.3-30.2. | 24.56 ppb | 60 | 2025 |
| Total Trihalomethanes (TTHM) Range 42.2-76.8. | 54.8 ppb | 80 | 2025 |
| Nitrate Range from below the detectable limit (<0.10) to 0.56. | 0.33 ppm | 10 | 2025 |
| Total Organic Carbon (removal ratio) Range 1.40-2.10; compliant with TOC removal requirements. | 1.79 ratio | TT (must exceed… | 2025 |
| Turbidity 100% of samples met the limit. | 0.09 NTU | 0.3 in 95% of… | 2025 |
| Lead (90th percentile) Two monitoring periods; the 90th percentile was non-detect in both, but 1 of 40 sites exceeded the action level each… | ND ppb | 15 (AL) | 2025 |
| Copper (90th percentile) First monitoring period; 0 of 40 sites over the action level, range ND-0.638. Second monitoring period 90th percentile… | 0.077 ppm | 1.3 (AL) | 2025 |
| Bromodichloromethane (unregulated) Range 5.1-11.5. Individual disinfection byproduct, no federal standard. | 8.2 ppb | none | 2025 |
Source: canfield.gov
EPA compliance record
Lead at the tap: 90th-percentile result 0 ppb in 2025 (action level 15 ppb).
EPA record: no health-based violations since 2015.
3 violations of any kind logged since 2020: 3 for a report, record or notice that was missing, late or incomplete (the yearly water quality report, a public notice, lead line records).
EPA compliance record · Mahoning Valley Sanitary District (treats the water)
Lead at the tap: 90th-percentile result 0 ppb in 2025 (action level 15 ppb).
EPA record: no health-based violations since 2015.
Projects & plans1
Planned or needed
- Mineral Ridge Dam rehabilitation (Mahoning Valley Sanitary District) · 2023 · planned
Not a Canfield project: MVSD, Canfield's wholesale supplier, is rehabilitating the Mineral Ridge dam that impounds Meander Creek Reservoir; environmental…
Source: meanderwater.org
Supply stress
Canfield controls no water source of its own. Its entire supply is finished water bought from the Mahoning Valley Sanitary District, which draws from Meander Creek Reservoir - a seven-mile-long, 2,010-acre impoundment with about 11 billion gallons of storage and 40 miles of shoreline, shared with Youngstown, Niles, McDonald and a string…
Source: canfield.govmeanderwater.org
Sewers
Sanitary
Canfield's Utility Billing Department administers a city sanitary sewer collection system alongside water and stormwater, serving customers inside and outside city limits. Domestic and industrial users are billed $9.68 per 1,000 gallons of metered water use; extra-territorial users pay $10.65 per 1,000 gallons. The city does not publish…
Storm
Canfield runs a stormwater utility billed at $8.00 per month per single-family residence; commercial, industrial and other properties pay $0.00472 per square foot of impervious surface. No flooding history or stormwater capital program was found on the city's…
Sourcesverified
Compiled from the utility's own reports and public records, then independently re-checked against primary sources.
Main supplier in 1 ZIP code
Serves
Main water supplier in 1 ZIP code
- 44406 · Canfield Township and Canfield52% of residents
Population-weighted resident shares; a ZIP code can have more than one system on record. Recomputed from each ZIP's own system list, not from the map's cached footprint.
Buys from · Sells to
Canfield City buys its water from Youngstown City, which buys from Mahoning Valley Sanitary District.
No other system is on record buying water from Canfield City.
What the records show about Canfield City
Who runs it
EPA's record describes Canfield City as owned by a local government. It has 3,410 service connections and serves 7,706 people.
EPA classes it as a community water system, one that serves the same residents all year.
Its office telephone on EPA's record is 330-533-1101.
Source: EPA Safe Drinking Water Information System (SDWIS), water system record.
How the water is treated
Canfield City buys water that Mahoning Valley Sanitary District treats first, so the steps that count are the seller's. EPA's treatment table registers these steps for Mahoning Valley Sanitary District: chloramine disinfection, corrosion control, coagulation and settling, chlorine disinfection, iron and manganese removal, fluoridation, lime softening, powdered activated carbon, and sand or media filtration.
Canfield City adds nothing of its own on that table.
The list is what each system registered with EPA for treatment plants EPA still shows as active, and it can lag a plant upgrade.
Source: EPA Safe Drinking Water Information System (SDWIS) treatment table (EPA Envirofacts, pulled September 2026).
Violations
EPA's record shows no health-based violations for Canfield City since 2015.
EPA logs 3 violations of any kind since 2020: 3 for a report, record or notice that was missing, late or incomplete (the yearly water quality report, a public notice, lead line records).
Source: EPA Safe Drinking Water Information System (SDWIS) violation records: health-based violations with compliance periods beginning in 2015 or later, all violations from 2020 or later (EPA Envirofacts, pulled September 2026).
Lead and copper at the tap
In the sampling period ending December 2025, the 90th-percentile lead result at Canfield City was 0 ppb, under both the current 15 ppb action level and the 10 ppb level that applies from 2027. A result of 0 means at least nine in ten of the homes sampled had no lead detected.
The highest result on file is 8.1 ppb, in the period ending June 2022.
EPA has 13 sampling periods on file for Canfield City since 2016, the first ending in 2017; no period was above 10 ppb.
Every water system has to inventory its service lines, the pipes from the main to each building. In the inventory Canfield City sent EPA, 3,309 lines are counted.
| Material | Lines |
|---|---|
| Lead | 0 |
| Galvanized, needing replacement | 0 |
| Unknown material | 148 |
| Not lead | 3,161 |
| All lines | 3,309 |
Systems sample taps in the homes most likely to have lead pipes or solder. The 90th-percentile result is the level nine in ten of the sampled homes were at or below. Lead comes mostly from service lines and house plumbing, not the source water, so a low result for the system does not clear an old house.
EPA's dashboard status for this inventory: reported all required service line types.
Source: EPA Safe Drinking Water Information System (SDWIS) lead and copper 90th-percentile results (EPA Envirofacts), sampling periods ending 2016 or later; EPA's service line inventory dashboard, Ohio's 2026 Q2 submission.
PFAS
EPA's fifth national round of testing (UCMR 5) took 5 samples of the water entering the pipes of Canfield City in 2024 and measured 29 PFAS.
The highest PFOA or PFOS result, 12.4 ng/L, is at or above the federal limit of 4 ng/L that EPA set in 2024. Systems have until 2029 to comply, and in May 2026 EPA proposed letting systems apply for two more years. One sample over the limit is not a violation: compliance is judged on a running annual average.
The highest PFAS results were PFOS 12.4 ng/L, PFBA 5.6 ng/L, and PFHxS 5.3 ng/L.
Ohio EPA's own statewide sampling tested 1 plant of Mahoning Valley Sanitary District (latest sample May 2021). The highest result was PFOS at 10.9 ppt (ppt is the same unit as ng/L), against Ohio's action level of 70 ppt. Those action levels are the ones Ohio EPA used for the survey; the 2024 federal limit for PFOA and PFOS is 4 ng/L.
Ohio EPA's current sampling status map lists 1 plant of Mahoning Valley Sanitary District as sampled, most recently July 2026.
| Compound | Highest result | Federal limit |
|---|---|---|
| PFOA | 4.2 ng/L | 4 ng/L |
| PFOS | 12.4 ng/L | 4 ng/L |
PFAS are the 'forever chemicals' from firefighting foam, plating shops and non-stick coatings. Results are for water leaving the plant, not your tap.
Source: EPA UCMR 5 occurrence data (final release, August 2026); Ohio EPA statewide PFAS sampling, 2019 to 2021, and its sampling status map.
Disinfection byproducts
Chlorine that disinfects water also reacts with organic matter to form byproducts. Two groups have federal limits: total trihalomethanes (TTHM, 80 µg/L) and five haloacetic acids (HAA5, 60 µg/L), judged on running yearly averages at each sampling site.
For TTHM, the average of Canfield City's samples in 2019, the last year it was sampled, was 57.3 µg/L. The worst yearly average was 62.6 µg/L and the highest single sample was 87.3 µg/L, from 63 samples taken from 2012 to 2019.
For HAA5, the average in the last year sampled was 27.1 µg/L. The worst yearly average was 39.7 µg/L and the highest single sample was 60 µg/L, from 61 samples.
| Byproduct | Limit | Latest yearly average | Worst yearly average | Highest sample | Samples |
|---|---|---|---|---|---|
| TTHM | 80 µg/L | 57.3 µg/L (2019) | 62.6 µg/L | 87.3 µg/L | 63 |
| HAA5 | 60 µg/L | 27.1 µg/L | 39.7 µg/L | 60 µg/L | 61 |
A yearly average of 0 means nothing was detected in that year's samples. EPA's file stops at 2019; Ohio EPA's Drinking Water Watch has newer results.
Source: EPA Six-Year Review 4 compliance monitoring data, 2012 to 2019, distribution-system samples (non-detects counted as zero).
Nitrate, arsenic and radioactivity
The water Canfield City buys is treated by Mahoning Valley Sanitary District, so the results below are Mahoning Valley Sanitary District's.
Nitrate: the highest of 187 samples was 0.71 mg/L (as nitrogen) in 2013; in 2019, the last year sampled, the highest was 0.47 mg/L. No sample was over the limit of 10 mg/L. Nitrate above 10 is unsafe for infants.
Arsenic was not detected in 3 samples (limit 10 µg/L).
| Contaminant | Samples | Highest result | Limit | Samples over limit |
|---|---|---|---|---|
| Nitrate (as nitrogen) | 187 | 0.71 mg/L | 10 mg/L | 0 |
| Arsenic | 3 | not detected | 10 µg/L | 0 |
Measured in finished water: at the plant's entry points and in the distribution system; raw well and intake samples are left out. Non-detects count as zero.
Source: EPA Six-Year Review 4 compliance monitoring data, 2012 to 2019, finished water of Mahoning Valley Sanitary District.
Solvents and fuels
The water Canfield City buys is treated by Mahoning Valley Sanitary District, so the results below are Mahoning Valley Sanitary District's.
EPA's file holds results for all six solvent and fuel compounds it checked. Benzene, carbon tetrachloride, 1,2-dichloroethane, trichloroethylene, tetrachloroethylene, and vinyl chloride were not detected in 13 samples each.
| Compound | Limit | Samples | Detected in | Highest result | Samples over limit |
|---|---|---|---|---|---|
| Benzene | 5 µg/L | 13 | 0 of 13 | not detected | 0 |
| Carbon tetrachloride | 5 µg/L | 13 | 0 of 13 | not detected | 0 |
| 1,2-dichloroethane | 5 µg/L | 13 | 0 of 13 | not detected | 0 |
| Trichloroethylene (TCE) | 5 µg/L | 13 | 0 of 13 | not detected | 0 |
| Tetrachloroethylene (PCE) | 5 µg/L | 13 | 0 of 13 | not detected | 0 |
| Vinyl chloride | 2 µg/L | 13 | 0 of 13 | not detected | 0 |
"Not detected" means the lab's result was below what its method can measure, not that the compound is absent. Non-detects count as zero in the highest-result column.
Source: EPA Six-Year Review 4 compliance monitoring data, 2012 to 2019, finished water of Mahoning Valley Sanitary District.
Farm chemicals and metals
The water Canfield City buys is treated by Mahoning Valley Sanitary District, so the results below are Mahoning Valley Sanitary District's.
EPA's file holds results for 8 of the nine herbicides and metals it checked. Detected: atrazine in 3 of 12 samples, highest 0.21 µg/L (limit 3); barium in 3 of 4 samples, highest 13 µg/L (limit 2,000). Not detected: alachlor in 12 samples, chromium in 4 samples, cadmium in 4 samples, mercury in 4 samples, selenium in 4 samples, thallium in 4 samples.
| Substance | Kind | Limit | Samples | Detected in | Highest result | Samples over limit |
|---|---|---|---|---|---|---|
| Atrazine | Farm chemical | 3 µg/L | 12 | 3 of 12 | 0.21 µg/L | 0 |
| Alachlor | Farm chemical | 2 µg/L | 12 | 0 of 12 | not detected | 0 |
| Chromium | Metal | 100 µg/L | 4 | 0 of 4 | not detected | 0 |
| Cadmium | Metal | 5 µg/L | 4 | 0 of 4 | not detected | 0 |
| Barium | Metal | 2,000 µg/L | 4 | 3 of 4 | 13 µg/L | 0 |
| Mercury | Metal | 2 µg/L | 4 | 0 of 4 | not detected | 0 |
| Selenium | Metal | 50 µg/L | 4 | 0 of 4 | not detected | 0 |
| Thallium | Metal | 2 µg/L | 4 | 0 of 4 | not detected | 0 |
Non-detects count as zero in the highest-result column.
Source: EPA Six-Year Review 4 compliance monitoring data, 2012 to 2019, finished water of Mahoning Valley Sanitary District.
Bacteria in the pipes
From 2012 to 2019, 0 of 1,009 routine total coliform samples taken in the distribution system at Canfield City tested positive (0%); in 2019, the last year on file, 0 of 121 did.
A positive coliform test is a warning sign, not a violation by itself. E. coli is a sign that human or animal waste may have reached the water. Coliform counts are routine samples only; E. coli counts include repeat samples.
Source: EPA Six-Year Review 4 compliance monitoring data, 2012 to 2019, distribution-system presence/absence tests for total coliform and E. coli.
Fluoride
The Ohio Department of Health's report to the CDC (My Water's Fluoride) says Canfield City buys its water from Mahoning Valley Sanitary District, a system that adjusts the fluoride level to the recommended level for preventing tooth decay.
EPA's treatment table lists fluoridation among the steps at Mahoning Valley Sanitary District, which treats the water Canfield City buys.
Measured fluoride: 1.01 mg/L on average leaving the plants of Mahoning Valley Sanitary District, which supplies Canfield City, in 2019 (in the range dentists aim for); samples ran from 0.87 to 1.12 mg/L across 4 samples in 2012 to 2019.
The recommended level for preventing tooth decay is 0.7 mg/L; the federal limit is 4 mg/L. The treatment list is what each system registered with EPA and can lag a plant upgrade.
Source: CDC My Water's Fluoride (fluoridation status as reported by the Ohio Department of Health, fetched September 2026); EPA Safe Drinking Water Information System (SDWIS) treatment table; EPA Six-Year Review 4 compliance monitoring data, 2012 to 2019, entry-point fluoride samples.
Lithium
Lithium was not detected in 4 UCMR 5 samples at Canfield City, last sampled in 2024 (the method reports from 9 µg/L).
Lithium is not regulated. EPA's draft health reference level is 10 µg/L, and it occurs naturally in deep groundwater, so well systems in the northwest run highest.
Source: EPA UCMR 5 occurrence data (final release, August 2026), samples from 2023 to 2025.
Algal toxins
The water Canfield City buys is treated by Mahoning Valley Sanitary District, so the results below are Mahoning Valley Sanitary District's.
Ohio EPA tests for microcystin, a toxin that harmful algal blooms can release, in raw water at the intake and in treated water.
At the intake, microcystin was detected 2 times in 220 raw-water samples, across 2 bloom seasons (2021 to 2023); the highest raw-water result was 0.335 µg/L on November 9, 2021. There has been no raw-water detection since 2024.
Microcystin was never detected in treated water (78 samples).
In all, 298 samples from 2016 to 2026, the latest on August 24, 2026.
| Water | Samples | Detections | Highest result |
|---|---|---|---|
| Raw water, at the intake | 220 | 2 | 0.335 µg/L |
| Treated water | 78 | 0 | not detected |
The ten-day advisory levels for treated water are 0.3 µg/L for children under six and 1.6 µg/L for everyone else. Any detection at the intake triggers more frequent testing until two clean weeks.
Source: Ohio EPA public water system harmful algal bloom monitoring, 2016 to present (HAB data, fetched September 2026).
How well the service area is mapped
EPA estimated the service area of Canfield City with a computer model rather than drawing it from the utility's map, so its edges are approximate.
Counting the people who live in the ZIP codes it overlaps, this atlas estimates 11,777 residents are inside the boundary, 153% of the 7,706 people Canfield City reports serving.
The resident count is an estimate from 2020 Census ZIP-code populations, not a count of customers.
Source: EPA Service Area Boundaries; resident estimate by this atlas from ZIP-code overlap.
Photograph
On the map
Show this system's territory on the map — 1 ZIP code in all.
Sources
U.S. EPA SDWIS and Community Water System Service Area Boundaries (v3, 2026), Ohio EPA primacy data, 2020 census blocks: the system serving most residents, traced through purchases to the treating utility; Ohio EPA 2023 Sewer and Water Rate Survey (Ohio State, May 2025) for household bills; Ohio EPA DEFA loan awards since 2016 for the loans paragraph · EPA SDWIS · EPA service area boundaries · Ohio EPA drinking water · Ohio EPA rate survey
EPA's own record for this system: Enforcement and Compliance History report for OH5000503 (EPA ECHO).
Notable facts: canfield.gov, meanderwater.org, canfield.gov
History: canfield.gov, canfield.gov, meanderwater.org, canfield.gov
Water quality: canfield.gov
Planned work: meanderwater.org
Water pressure: canfield.gov
Rates: canfield.gov, canfield.gov, canfield.gov
Sewers: canfield.gov, canfield.gov, canfield.gov
Treatment: canfield.gov, canfield.gov, meanderwater.org
Supply stress: canfield.gov, meanderwater.org
