Water system
Northern Ohio Rural Water-south District
EPA ID OH3946712 · Huron County · 5,226 people served · owned by a local government
Northern Ohio Rural Water-south District buys its water from Erie Co. Margaretta District.
The system's record
Also connected to Willard City (West Branch Huron River, stored in Willard's upground reservoir), used as a secondary or emergency supply.
- Water bodies
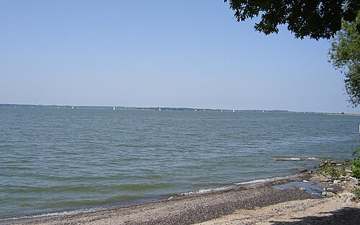
- Lake Erie, Sandusky Bay
- Raw intakes
- Sandusky Bay
Lake Erie - Serves
- 25,793 people · Erie County
- EPA ID
- OH2201411
About this area's water Sandusky City
Did you know
- Despite the name, Big Island Water Works does not drink from Sandusky Bay: its primary intake is a 42-inch steel pipe three-quarters of a mile out into Lake Erie off the Cedar Point Chaussee, gravity-fed to the plant…
- The plant has tested for microcystins every year since 2011 — the same liver toxin from harmful algal blooms that shut down Toledo's water supply in 2014 — and reported non-detect results in 2024.
- In mid-January 2024 a frazil-ice event (slushy ice that forms in supercooled, turbulent water and can clog an intake) forced the plant to switch temporarily to its emergency Sandusky Bay intake.
- The 2024 report shows no treatment violations and a 90th-percentile lead result of 6 ppb, with the highest single tap sample at 13 ppb — none of the 30 homes tested reached the 15 ppb threshold.
- The report's author, Water Services Superintendent William R. Burch, was in his 23rd year of commercial water purification and holds a Class IV Ohio EPA water supply operator certification.
Source: cms6.revize.com
History4
- 2011Big Island Water Works began testing finished water for algal toxins (microcystins) from Lake Erie harmful algal blooms; the treatment process has removed them every year since.
- 2023The plant's emergency-generator master control console failed in late 2023, prompting the city to prioritize an emergency-controls upgrade; during the equipment lead time staff manually tested…
- 2024BIWW replaced the 20-year-old control panels on each emergency generator, and one frazil-ice event in mid-January forced a temporary switch to the emergency Sandusky Bay intake.
- 2024City Commission approved a seven-year water and sewer rate schedule (effective June 1, 2024) raising water rates 15% in 2024 and 2025 and 3% per year 2026-2030.
Treatment & pressure
How it is treated
Surface water from Lake Erie enters through a 42-inch steel intake pipe located three-quarters of a mile off the Cedar Point Chaussee and is gravity-fed to the Big Island Water Works plant (2425 First Street). Treatment includes filtration (turbidity held to 0.19 NTU maximum in 2024, 100% of…
Source: cms6.revize.com
Water pressure
No psi figures or pressure zones are published. The 2024 CCR states only that city water mains are pressurized under normal conditions and that pressure is 'greatly reduced'…
Source: cms6.revize.com
What it costs
$8.03 per 1,000 gallons
Typical household bill about $30 a month for water.
The city does not publish a per-1,000-gallon commodity rate. Its approved schedule gives the average single-family water bill (5 CCF = 500 cubic feet, about 3,740 gallons per…
Source: cityofsandusky.com
Water quality & impurities10
| Contaminant | Level | Limit | Year |
|---|---|---|---|
| TTHM (Total Trihalomethanes) Chlorination by-product; quarterly sampling, range 16.9-88.4 ppb. No violation. | 59.7 ppb | 80 (MCL) | 2024 |
| HAA5 (Haloacetic Acids) Chlorination by-product; quarterly sampling, range 7.2-33.2 ppb. No violation. | 24.3 ppb | 60 (MCL) | 2024 |
| Lead (90th percentile) From 30 tap samples collected June 20-28, 2024. Lowest result was <4 ppb (non-detect), highest single sample 13 ppb… | 6 ppb | 15 (action… | 2024 |
| Copper (90th percentile) Same 30-sample round as lead; 0 of 30 homes exceeded. | 42 ppb | 1350 (action… | 2024 |
| Nitrate Monthly monitoring; range reported as 0.0-1.45 ppm in the CCR table. | 1.9 ppm | 10 (MCL) | 2024 |
| Fluoride Daily monitoring; range 0.7-1.03 ppm. Added to promote strong teeth. | 0.89 ppm | 4 (MCL) | 2024 |
| Turbidity Highest recorded reading; range 0.01-0.19 NTU and 100% of monthly samples met the limit. | 0.19 NTU | 0.30 NTU in 95%… | 2024 |
| Barium Range 0.016-0.016; erosion of natural deposits, drilling wastes, metal refineries. | 0.016 ppm | 2 (MCL) | 2024 |
| Chlorine (residual) Continuous monitoring; range 1.03-1.45 ppm. | 1.3 ppm | 4 (MRDL) | 2024 |
| Total Organic Carbon (removal ratio) Monthly; range reported 1.1-2.0. | 1.1 ratio | treatment… | 2024 |
Source: cms6.revize.com
EPA compliance record · Northern Ohio Rural Water-south District
Lead at the tap: 90th-percentile result 0 ppb in 2025 (action level 15 ppb).
EPA record: no health-based violations since 2015.
EPA compliance record · Sandusky City (treats the water)
Lead at the tap: 90th-percentile result 5 ppb in 2025 (action level 15 ppb).
EPA record: no health-based violations since 2015.
1 violation of any kind logged since 2020: 1 for a report, record or notice that was missing, late or incomplete (the yearly water quality report, a public notice, lead line records).
Projects & plans1
Recent and current work
- Emergency generator control panel replacement · 2024 · completed
Replaced the 20-year-old control panels on each of the plant's emergency generators after the master control console failed in late 2023. No cost is published.
Source: cms6.revize.com
Supply stress
Lake Erie is a large, renewable surface source with no volumetric capacity constraint, but Ohio EPA treats all Ohio surface waters as susceptible to contamination because they are accessible and can be contaminated quickly, with short travel times from source to intake. Sandusky's own source-water assessment finds that even though the…
Source: cms6.revize.com
Sewers
Sanitary
Sanitary sewer service is run by the City of Sandusky's Water Pollution Control division (419.627.5907).
Storm
The city's source-water assessment lists combined sewer overflows among the contamination risks to its Lake Erie intake, indicating at least a partial combined sewer system. Sewer rates are held flat in 2024-2025 and rise 3% per year 2026-2030 under the…
Sourcesverified
Compiled from the utility's own reports and public records, then independently re-checked against primary sources.
Present in 0 ZIP codes
Serves
No ZIP code has Northern Ohio Rural Water-south District on record as its main water supplier.
Population-weighted resident shares; a ZIP code can have more than one system on record. Recomputed from each ZIP's own system list, not from the map's cached footprint.
Buys from · Sells to
Northern Ohio Rural Water-south District buys its water from Erie Co. Margaretta District, which buys from Sandusky City.
No other system is on record buying water from Northern Ohio Rural Water-south District.
What the records show about Northern Ohio Rural Water-south District
Who runs it
EPA's record describes Northern Ohio Rural Water-south District as owned by a local government. It has 2,353 service connections and serves 5,226 people.
EPA classes it as a community water system, one that serves the same residents all year.
Its office telephone on EPA's record is 419-668-7213.
Source: EPA Safe Drinking Water Information System (SDWIS), water system record.
How the water is treated
Northern Ohio Rural Water-south District buys water that Sandusky City treats first, so the steps that count are the seller's. EPA's treatment table registers these steps for Sandusky City: aeration, corrosion control, coagulation and settling, chlorine disinfection, iron and manganese removal, fluoridation, powdered activated carbon, and sand or media filtration.
The list is what each system registered with EPA for treatment plants EPA still shows as active, and it can lag a plant upgrade.
Source: EPA Safe Drinking Water Information System (SDWIS) treatment table (EPA Envirofacts, pulled September 2026).
Violations
EPA's record shows no health-based violations for Northern Ohio Rural Water-south District since 2015.
EPA logs no violations of any kind for Northern Ohio Rural Water-south District since 2020.
Source: EPA Safe Drinking Water Information System (SDWIS) violation records: health-based violations with compliance periods beginning in 2015 or later, all violations from 2020 or later (EPA Envirofacts, pulled September 2026).
Lead and copper at the tap
In the sampling period ending December 2025, the 90th-percentile lead result at Northern Ohio Rural Water-south District was 0 ppb, under both the current 15 ppb action level and the 10 ppb level that applies from 2027. A result of 0 means at least nine in ten of the homes sampled had no lead detected.
EPA has 4 sampling periods on file for Northern Ohio Rural Water-south District since 2016, the first ending in 2016; no period was above 10 ppb.
Every water system has to inventory its service lines, the pipes from the main to each building. In the inventory Northern Ohio Rural Water-south District sent EPA, 2,352 lines are counted.
| Material | Lines |
|---|---|
| Lead | 0 |
| Galvanized, needing replacement | 0 |
| Unknown material | 816 |
| Not lead | 1,536 |
| All lines | 2,352 |
Systems sample taps in the homes most likely to have lead pipes or solder. The 90th-percentile result is the level nine in ten of the sampled homes were at or below. Lead comes mostly from service lines and house plumbing, not the source water, so a low result for the system does not clear an old house.
EPA's dashboard status for this inventory: reported all required service line types.
Source: EPA Safe Drinking Water Information System (SDWIS) lead and copper 90th-percentile results (EPA Envirofacts), sampling periods ending 2016 or later; EPA's service line inventory dashboard, Ohio's 2026 Q2 submission.
PFAS
EPA's fifth national round of testing (UCMR 5) took 5 samples of the water entering the pipes of Northern Ohio Rural Water-south District in 2023 and measured 29 PFAS.
PFOA and PFOS were not detected, against a federal limit of 4 ng/L each.
The highest PFAS result was PFBA 15.6 ng/L.
Ohio EPA's own statewide sampling tested 1 plant of Sandusky City (latest sample September 2020). Not one of the six PFAS tested (PFOA, PFOS, PFHxS, PFNA, GenX and PFBS) was detected.
Ohio EPA's current sampling status map lists 1 plant of Sandusky City as sampled, most recently June 2026.
| Compound | Highest result | Federal limit |
|---|---|---|
| PFOA | not detected | 4 ng/L |
| PFOS | not detected | 4 ng/L |
PFAS are the 'forever chemicals' from firefighting foam, plating shops and non-stick coatings. Results are for water leaving the plant, not your tap.
Source: EPA UCMR 5 occurrence data (final release, August 2026); Ohio EPA statewide PFAS sampling, 2019 to 2021, and its sampling status map.
Disinfection byproducts
Chlorine that disinfects water also reacts with organic matter to form byproducts. Two groups have federal limits: total trihalomethanes (TTHM, 80 µg/L) and five haloacetic acids (HAA5, 60 µg/L), judged on running yearly averages at each sampling site.
For TTHM, the average of Northern Ohio Rural Water-south District's samples in 2019, the last year it was sampled, was 40.3 µg/L. The worst yearly average was 86.2 µg/L and the highest single sample was 127.5 µg/L, from 60 samples taken from 2012 to 2019. A yearly average over 80 is not itself a violation, because compliance is judged site by site.
For HAA5, the average in the last year sampled was 28.4 µg/L. The worst yearly average was 42.6 µg/L and the highest single sample was 60.5 µg/L, from 60 samples.
| Byproduct | Limit | Latest yearly average | Worst yearly average | Highest sample | Samples |
|---|---|---|---|---|---|
| TTHM | 80 µg/L | 40.3 µg/L (2019) | 86.2 µg/L | 127.5 µg/L | 60 |
| HAA5 | 60 µg/L | 28.4 µg/L | 42.6 µg/L | 60.5 µg/L | 60 |
A yearly average of 0 means nothing was detected in that year's samples. EPA's file stops at 2019; Ohio EPA's Drinking Water Watch has newer results.
Source: EPA Six-Year Review 4 compliance monitoring data, 2012 to 2019, distribution-system samples (non-detects counted as zero).
Nitrate, arsenic and radioactivity
The water Northern Ohio Rural Water-south District buys is treated by Sandusky City, so the results below are Sandusky City's.
Nitrate: the highest of 96 samples was 2.04 mg/L (as nitrogen) in 2013; in 2019, the last year sampled, the highest was 1.81 mg/L. No sample was over the limit of 10 mg/L. Nitrate above 10 is unsafe for infants.
Arsenic: the highest of 10 samples was 2.2 µg/L (limit 10); detections averaged 2.2; none over the limit.
| Contaminant | Samples | Highest result | Limit | Samples over limit |
|---|---|---|---|---|
| Nitrate (as nitrogen) | 96 | 2.04 mg/L | 10 mg/L | 0 |
| Arsenic | 10 | 2.2 µg/L | 10 µg/L | 0 |
Measured in finished water: at the plant's entry points and in the distribution system; raw well and intake samples are left out. Non-detects count as zero.
Source: EPA Six-Year Review 4 compliance monitoring data, 2012 to 2019, finished water of Sandusky City.
Solvents and fuels
The water Northern Ohio Rural Water-south District buys is treated by Sandusky City, so the results below are Sandusky City's.
EPA's file holds results for all six solvent and fuel compounds it checked. Benzene, carbon tetrachloride, 1,2-dichloroethane, trichloroethylene, tetrachloroethylene, and vinyl chloride were not detected in 8 samples each.
| Compound | Limit | Samples | Detected in | Highest result | Samples over limit |
|---|---|---|---|---|---|
| Benzene | 5 µg/L | 8 | 0 of 8 | not detected | 0 |
| Carbon tetrachloride | 5 µg/L | 8 | 0 of 8 | not detected | 0 |
| 1,2-dichloroethane | 5 µg/L | 8 | 0 of 8 | not detected | 0 |
| Trichloroethylene (TCE) | 5 µg/L | 8 | 0 of 8 | not detected | 0 |
| Tetrachloroethylene (PCE) | 5 µg/L | 8 | 0 of 8 | not detected | 0 |
| Vinyl chloride | 2 µg/L | 8 | 0 of 8 | not detected | 0 |
"Not detected" means the lab's result was below what its method can measure, not that the compound is absent. Non-detects count as zero in the highest-result column.
Source: EPA Six-Year Review 4 compliance monitoring data, 2012 to 2019, finished water of Sandusky City.
Farm chemicals and metals
The water Northern Ohio Rural Water-south District buys is treated by Sandusky City, so the results below are Sandusky City's.
EPA's file holds results for 8 of the nine herbicides and metals it checked. Detected: atrazine in 1 of 12 samples, highest 0.1 µg/L (limit 3); cadmium in 1 of 10 samples, highest 1.8 µg/L (limit 5); barium in 9 of 9 samples, highest 21.3 µg/L (limit 2,000); thallium in 1 of 13 samples, highest 4.4 µg/L (limit 2, 1 over). Not detected: alachlor in 12 samples, chromium in 10 samples, mercury in 10 samples, selenium in 10 samples.
| Substance | Kind | Limit | Samples | Detected in | Highest result | Samples over limit |
|---|---|---|---|---|---|---|
| Atrazine | Farm chemical | 3 µg/L | 12 | 1 of 12 | 0.1 µg/L | 0 |
| Alachlor | Farm chemical | 2 µg/L | 12 | 0 of 12 | not detected | 0 |
| Chromium | Metal | 100 µg/L | 10 | 0 of 10 | not detected | 0 |
| Cadmium | Metal | 5 µg/L | 10 | 1 of 10 | 1.8 µg/L | 0 |
| Barium | Metal | 2,000 µg/L | 9 | 9 of 9 | 21.3 µg/L | 0 |
| Mercury | Metal | 2 µg/L | 10 | 0 of 10 | not detected | 0 |
| Selenium | Metal | 50 µg/L | 10 | 0 of 10 | not detected | 0 |
| Thallium | Metal | 2 µg/L | 13 | 1 of 13 | 4.4 µg/L | 1 |
Non-detects count as zero in the highest-result column.
Source: EPA Six-Year Review 4 compliance monitoring data, 2012 to 2019, finished water of Sandusky City.
Bacteria in the pipes
From 2012 to 2019, 0 of 574 routine total coliform samples taken in the distribution system at Northern Ohio Rural Water-south District tested positive (0%); in 2019, the last year on file, 0 of 83 did.
A positive coliform test is a warning sign, not a violation by itself. E. coli is a sign that human or animal waste may have reached the water. Coliform counts are routine samples only; E. coli counts include repeat samples.
Source: EPA Six-Year Review 4 compliance monitoring data, 2012 to 2019, distribution-system presence/absence tests for total coliform and E. coli.
Fluoride
The Ohio Department of Health's report to the CDC (My Water's Fluoride) says Northern Ohio Rural Water-south District buys its water from Sandusky City, a system that adjusts the fluoride level to the recommended level for preventing tooth decay.
EPA's treatment table lists fluoridation among the steps at Sandusky City, which treats the water Northern Ohio Rural Water-south District buys.
Measured fluoride: 0.94 mg/L on average leaving the plants of Sandusky City, which supplies Northern Ohio Rural Water-south District, in 2019 (in the range dentists aim for); samples ran from 0.9 to 1.03 mg/L across 10 samples in 2012 to 2019.
The recommended level for preventing tooth decay is 0.7 mg/L; the federal limit is 4 mg/L. The treatment list is what each system registered with EPA and can lag a plant upgrade.
Source: CDC My Water's Fluoride (fluoridation status as reported by the Ohio Department of Health, fetched September 2026); EPA Safe Drinking Water Information System (SDWIS) treatment table; EPA Six-Year Review 4 compliance monitoring data, 2012 to 2019, entry-point fluoride samples.
Lithium
Lithium was not detected in 4 UCMR 5 samples at Northern Ohio Rural Water-south District, last sampled in 2023 (the method reports from 9 µg/L).
Lithium is not regulated. EPA's draft health reference level is 10 µg/L, and it occurs naturally in deep groundwater, so well systems in the northwest run highest.
Source: EPA UCMR 5 occurrence data (final release, August 2026), samples from 2023 to 2025.
Algal toxins
The water Northern Ohio Rural Water-south District buys is treated by Sandusky City, so the results below are Sandusky City's.
Ohio EPA tests for microcystin, a toxin that harmful algal blooms can release, in raw water at the intake and in treated water.
At the intake, microcystin was detected 17 times in 291 raw-water samples, across 4 bloom seasons (2016 to 2021); the highest raw-water result was 3.834 µg/L on August 30, 2021. There has been no raw-water detection since 2024.
Microcystin was never detected in treated water (307 samples).
In all, 598 samples from 2016 to 2026, the latest on August 24, 2026.
| Water | Samples | Detections | Highest result |
|---|---|---|---|
| Raw water, at the intake | 291 | 17 | 3.834 µg/L |
| Treated water | 307 | 0 | not detected |
The ten-day advisory levels for treated water are 0.3 µg/L for children under six and 1.6 µg/L for everyone else. Any detection at the intake triggers more frequent testing until two clean weeks.
Source: Ohio EPA public water system harmful algal bloom monitoring, 2016 to present (HAB data, fetched September 2026).
Water and sewer bills
Ohio EPA's 2023 rate survey puts the water bill at Northern Ohio Rural Water-south District for a household using 5,000 gallons a month at $612 a year, about $51 a month.
| Use | Water, per year | Sewer, per year |
|---|---|---|
| 2,500 gallons a month | $336 | not on file |
| 5,000 gallons a month | $612 | not on file |
| 8,000 gallons a month | $1,080 | not on file |
The survey lists it as “Northern Ohio Rural Water - South”. These are inside-city rates and annual bills at the use shown.
Source: Ohio EPA 2023 Sewer and Water Rate Survey (Ohio State University, May 2025).
On the map
Show this system's territory on the map — 0 ZIP codes in all.
Sources
U.S. EPA SDWIS and Community Water System Service Area Boundaries (v3, 2026), Ohio EPA primacy data, 2020 census blocks: the system serving most residents, traced through purchases to the treating utility; Ohio EPA 2023 Sewer and Water Rate Survey (Ohio State, May 2025) for household bills; Ohio EPA DEFA loan awards since 2016 for the loans paragraph · EPA SDWIS · EPA service area boundaries · Ohio EPA drinking water · Ohio EPA rate survey
EPA's own record for this system: Enforcement and Compliance History report for OH3946712 (EPA ECHO).
Northern Ohio Rural Water-south District's own pages: norw.org
