Water system
Greenville City
EPA ID OH1900714 · Darke County · 13,227 people served · owned by a local government
Greenville City treats its own water from Greenville Creek (primary, ~78%) blended with 8 wells.
The system's record
- Aquifer
- local wells (east/south of treatment plant)
- Water bodies
- Greenville Creek, Mud Creek
- Raw intakes
- Greenville Mud Creek
Greenville Greenville Creek - Active wells
- 8
- Serves
- 13,227 people · Darke County
- EPA ID
- OH1900714
About 78% of water comes from the Greenville Creek surface intake (Mud Creek is a tributary/alternate intake); the system switches more to its 8 wells when creek turbidity rises.
About this area's water
Did you know
- Greenville's drinking water intake and its sewage outfall are on the same stream: the water plant draws from Greenville Creek at 4160 State Route 502, and the wastewater plant discharges treated effluent back into…
- In 1805 Tecumseh and his brother Tenskwatawa, the Shawnee Prophet, founded a village at the confluence of Greenville and Mud creeks — temporary home to about 800 Shawnee — and kept signal fires burning in protest of the…
- The city bills water in units of 100 cubic feet and tells customers on its own rate sheet that this equals 750 gallons; the exact figure is about 748, so Greenville rounds a couple of gallons a month in the customer's…
- Greenville is a hybrid system: roughly two-thirds of what it treats is creek water, but when the creek turns muddy the plant leans on eight wells, so the same tap can swing between a surface and a groundwater supply…
- The city's fluoride level averages 0.26 ppm, well under the 0.7 ppm recommended for dental health — unusually low for a system that softens with lime.
History5
- 1795The Treaty of Greenville was signed on August 3 at Fort Greenville, ending the Northwest Indian War; the city that grew on the site still calls itself 'The Treaty City' on the municipal seal printed…
- 1980The current water treatment facility was constructed at 4160 State Route 502 — a lime softening plant with a design average capacity of 4 million gallons per day and a maximum design flow of 6 MGD.
- 2025City published its Lead Service Line Inventory under the federal Lead and Copper Rule Improvements and opened a lead service line replacement program with resident work-agreement forms.
- 2025Tier 3 monitoring violation: the system did not monitor for total microcystins during the week of 5/18/2025-5/24/2025 as required by Ohio EPA. A sample was collected 5/29/2025 and the public notice…
- 2025System held an unconditioned license to operate and participated in the fifth round of UCMR 5 sampling, producing the city's first published PFAS results.
Source: cityofgreenville.orgcityofgreenville.orgcityofgreenville.org
Treatment & pressure
How it is treated
Lime softening plant built in 1980 at 4160 State Route 502, with a design average capacity of 4 MGD and a maximum design flow of 6 MGD; it currently produces an average of about 2.1 MGD. It treats a blend of Greenville Creek surface water — approximately two-thirds of the water treated — with…
Source: cityofgreenville.orgcityofgreenville.orgcityofgreenville.org
Water pressure
Not published. No distribution pressure figure or pressure-zone map appears in the 2024 or 2025 CCRs, the Rules and Regulations for the Greenville Water System (2025), or any city…
What it costs
$7.79 per 1,000 gallons
Typical household bill about $28 a month for water.
Ordinance 24-120, effective with 3/1/2026 billing. Greenville bills in 'billing units' of 100 cubic feet, which the city's own rate sheet equates to 750 gallons (the exact…
Source: cityofgreenville.org
Water quality & impurities10
| Contaminant | Level | Limit | Year |
|---|---|---|---|
| Total Trihalomethanes (TTHM) Range 13.4-84.5 ppb. The locational running annual average complies, but the highest single result exceeded the 80 ppb… | 57.6 ppb | 80 | 2025 |
| Lead (90th percentile) Range ND-25.0 ppb; 1 of 37 sites exceeded the action level, with one sample detected at 25 ppb. The 90th percentile is… | ND ppb | 15 (action… | 2025 |
| Nitrate Range 0.10-3.84 ppm — about 38% of the MCL, consistent with an agricultural watershed. Up sharply from 2.26 ppm in 2024. | 3.84 ppm | 10 | 2025 |
| Total Organic Carbon (TOC removal ratio) Reported as an amount detected of 0.9 with a monthly range of ND-1.30. The CCR's own footnote states that a value below… | 0.9 ratio | 1 (treatment… | 2025 |
| Haloacetic Acids (HAA5) Range ND-19.8 ppb. Disinfection byproduct, comfortably under the MCL. | 14.1 ppb | 60 | 2025 |
| Perfluorooctanesulfonic acid (PFOS) Range ND-6.3 ppt, from UCMR 5 sampling. The average is about half the federal MCL adopted in 2024, but individual… | 2.10 ppt | 4.0 | 2025 |
| Perfluorohexanesulfonic acid (PFHxS) Range ND-5.9 ppt. Regulated through EPA's mixture Hazard Index rather than an individual MCL. | 1.97 ppt | 10 (hazard… | 2025 |
| Chlorine Range 1.01-1.40 ppm. Water additive used to control microbes. | 1.24 ppm | 4 (MRDL) | 2025 |
| Turbidity 100% of monthly samples met the limit in 2025 — an improvement on 2024, when a meter malfunction produced a recorded… | 0.21 NTU | 1 (treatment… | 2025 |
| Sodium Relevant to anyone on a sodium-restricted diet; a byproduct of lime softening plus road salt in the watershed. Up from… | 30.6 ppm | none… | 2025 |
Source: cityofgreenville.orgcityofgreenville.org
EPA compliance record
Lead at the tap: 90th-percentile result 0 ppb in 2025 (action level 15 ppb).
EPA health-based violations since 2015:
- 2017Total coliform · treatment technique violation · returned to compliance
2 violations of any kind logged since 2020, 2 of them paperwork (monitoring, reporting, public notice or consumer report).
Projects & plans2
Recent and current work
- Lead Service Line Replacement Program · 2025 · under construction
City-run replacement following the Lead Service Line Inventory published in 2025 under the federal Lead and Copper Rule Improvements. Residents sign a work…
Source: cityofgreenville.orgcityofgreenville.orgcityofgreenville.org
Planned or needed
- Continued lead service line replacement · planned
Ongoing multi-year program following the 2025 inventory, on the federal Lead and Copper Rule Improvements timeline. No completion date or budget is published.
Supply stress
Ohio EPA's source water assessment rates the overall susceptibility of Greenville's system as HIGH. Because the system blends surface and ground water before distribution, the rating is set by the more susceptible source: the Greenville Creek surface intake, whose protection area is most susceptible to contamination from agricultural…
Sewers
Sanitary
City-owned oxidation ditch plant at 209 N Ohio Street, designed to provide preliminary, primary, secondary and advanced treatment with disinfection of the effluent. Design flow 3.5 MGD, peak hour flow 6.02 MGD, and 7.21 MGD design storm flow; average daily flow is about 2.2 million gallons. Approximately 0.257 dry tons of biosolids are…
Storm
The city operates a storm water utility and bills a separate storm charge of $3.10 per Equivalent Residential Unit per month under Ordinance 24-120, effective with 3/1/2026 billing. It appears as a line on every residential utility bill and is included in the…
Sourcesverified
Compiled from the utility's own reports and public records, then independently re-checked against primary sources.
Main supplier in 1 ZIP code
Serves
Main water supplier in 1 ZIP code
- 45331 · Greenville58% of residents
Population-weighted resident shares; a ZIP code can have more than one system on record. Recomputed from each ZIP's own system list, not from the map's cached footprint.
Buys from · Sells to
Greenville City does not buy water from another system on record; it treats its own source water.
No other system is on record buying water from Greenville City.
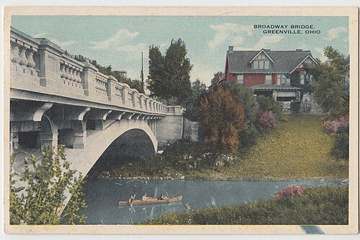
Photograph
On the map
Show this system's territory on the map — 1 ZIP code in all.
Sources
U.S. EPA SDWIS and Community Water System Service Area Boundaries (v3, 2026), Ohio EPA primacy data, 2020 census blocks: the system serving most residents, traced through purchases to the treating utility; Ohio EPA 2023 Sewer and Water Rate Survey (Ohio State, May 2025) for household bills; Ohio EPA DEFA loan awards since 2016 for the loans paragraph · EPA SDWIS · EPA service area boundaries · Ohio EPA drinking water · Ohio EPA rate survey
Greenville City's own pages: cityofgreenville.org, greenvillewater.com
Notable facts: cityofgreenville.org, hmdb.org, en.wikipedia.org, cityofgreenville.org
History: cityofgreenville.org, cityofgreenville.org, cityofgreenville.org, en.wikipedia.org
Water quality: cityofgreenville.org, cityofgreenville.org
Planned work: cityofgreenville.org, cityofgreenville.org
Water pressure: cityofgreenville.org, cityofgreenville.org
Capital projects: cityofgreenville.org, cityofgreenville.org, cityofgreenville.org
Rates: cityofgreenville.org
Sewers: cityofgreenville.org, cityofgreenville.org
Treatment: cityofgreenville.org, cityofgreenville.org, cityofgreenville.org
Supply stress: cityofgreenville.org, cityofgreenville.org