Allen County · Presidential elections
Allen County in presidential elections, 1852-2024
Allen County has voted in 44 presidential elections in this record, from 1852 to 2024. It went Republican 26 times and Democratic 18 times. It has voted Republican in every presidential election since 1940, 22 in a row; the last Democrat to carry it was Franklin D. Roosevelt in 1936, by 4.2 points. In 2024 Donald J Trump won it with 71.6% of the vote, a 44.1-point margin over Kamala D Harris. Measured as the Republican share minus the Democratic share, the county was 32.9 points more Republican than Ohio, and it ranked 45th of 88 counties from most Republican to most Democratic.
What 44 elections add up to
Each line is worked out from the table further down. "Margin" there is the winner's share minus the runner-up's; "lean" is the Republican share minus the Democratic share.
- With the nation
- Allen County voted for the candidate who won the presidency in 23 of 44 elections, 75th among Ohio's 88 counties by that count (tied with 6 others). The most recent miss was 2020, when it voted for Donald J Trump and the country elected Joe Biden.
- With Ohio
- It voted the same way as Ohio as a whole in 23 of 44 elections. The last time it parted from the state was 2012: Mitt Romney carried the county, Barack H. Obama carried Ohio.
- Years it changed sides
- The party carrying the county changed 5 times: in 1904, 1908, 1920, 1932 and 1940.
- Closest result
- 1860: Stephen A. Douglas (Democratic) over Abraham Lincoln by 2.30 points, 86 votes.
- Widest result
- 1984: Ronald Reagan (Republican) with 72.98%, 46.5 points ahead of Walter F. Mondale.
- Biggest move toward the Republicans
- From 1964 to 1968 the margin moved 29.3 points toward the Republicans, from R+2.3 to R+31.6. Lean counts only the two major parties; George Wallace (American Independent) took 11.0% in 1968.
- Biggest move toward the Democrats
- From 1928 to 1932 the margin moved 43.3 points toward the Democrats, from R+37.0 to D+6.3.
- Outside the two parties
- Theodore Roosevelt (Progressive) took 19.78% in 1912, 2,337 votes, the largest share any candidate outside the two major parties has won in the county.
- Where it stands among the 88
- Ranked by margin each year, from most Republican (1st) to most Democratic, the county stood highest in 1964 (3rd of 88, R+2.3) and lowest in 1888 (75th of 88, D+14.9). Since 2000 it has moved from 11th to 45th.
- Votes and turnout
- 2,517 votes were counted for president in 1852 and 46,369 in 2024. Turnout in 2024 was 70.76% of registered voters, 70th among the 88 counties (Ohio: 71.71%).
Every election at a glance
One bar per election, oldest at the left; bar height is the winning margin, color the winner's party. The dot rows mark the years the county matched Ohio's winner and the nation's. Each bar opens that year's full count.
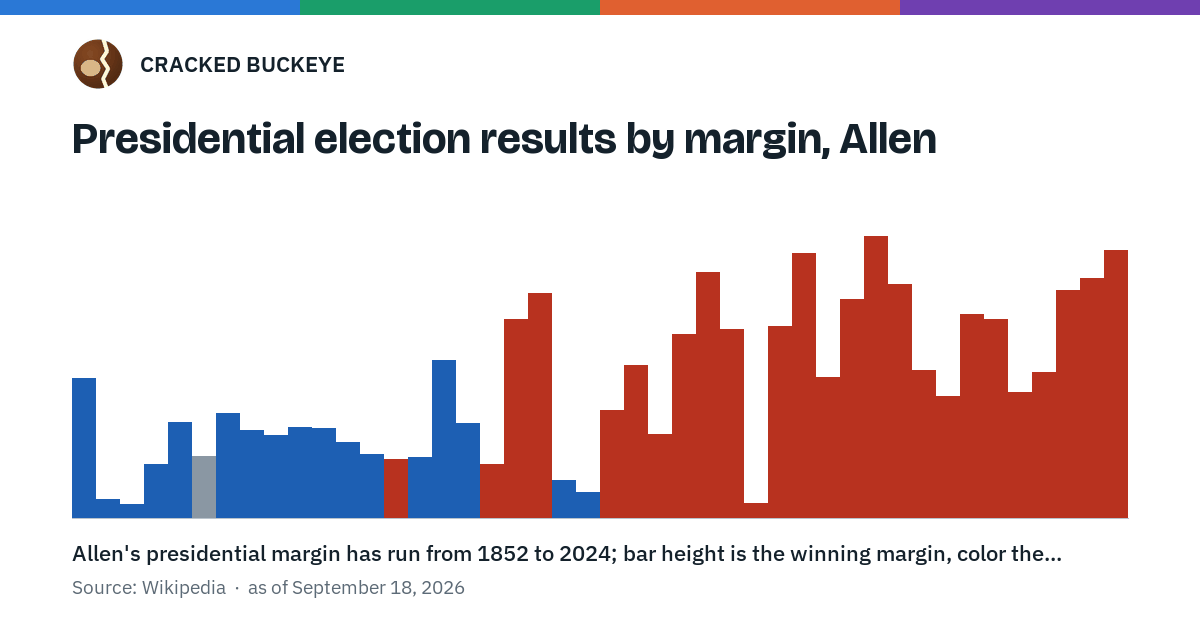
The numbers behind this figure, as a table
| Year | Winner | Party | Margin | Matched Ohio's winner | Matched the nation |
|---|---|---|---|---|---|
| 1852 | Franklin Pierce | D | 23.0 points | matched | matched |
| 1856 | James Buchanan | D | 3.1 points | missed | matched |
| 1860 | Stephen A. Douglas | D | 2.3 points | missed | missed |
| 1864 | George B. McClellan | D | 8.8 points | missed | missed |
| 1868 | Horatio Seymour | D | 15.7 points | missed | missed |
| 1872 | Horace Greeley | LR | 10.0 points | missed | missed |
| 1876 | Samuel J. Tilden | D | 17.2 points | missed | missed |
| 1880 | Winfield Scott Hancock | D | 14.4 points | missed | missed |
| 1884 | Grover Cleveland | D | 13.5 points | missed | matched |
| 1888 | Grover Cleveland | D | 14.9 points | missed | missed |
| 1892 | Grover Cleveland | D | 14.7 points | missed | matched |
| 1896 | William Jennings Bryan | D | 12.5 points | missed | missed |
| 1900 | William Jennings Bryan | D | 10.5 points | missed | missed |
| 1904 | Theodore Roosevelt | R | 9.6 points | matched | matched |
| 1908 | William Jennings Bryan | D | 10.0 points | missed | missed |
| 1912 | Woodrow Wilson | D | 25.9 points | matched | matched |
| 1916 | Woodrow Wilson | D | 15.5 points | matched | matched |
| 1920 | Warren G. Harding | R | 8.9 points | matched | matched |
| 1924 | Calvin Coolidge | R | 32.8 points | matched | matched |
| 1928 | Herbert Hoover | R | 37.0 points | matched | matched |
| 1932 | Franklin D. Roosevelt | D | 6.3 points | matched | matched |
| 1936 | Franklin D. Roosevelt | D | 4.2 points | matched | matched |
| 1940 | Wendell Willkie | R | 17.7 points | missed | missed |
| 1944 | Thomas E. Dewey | R | 25.2 points | matched | missed |
| 1948 | Thomas E. Dewey | R | 13.8 points | missed | missed |
| 1952 | Dwight D. Eisenhower | R | 30.2 points | matched | matched |
| 1956 | Dwight D. Eisenhower | R | 40.4 points | matched | matched |
| 1960 | Richard Nixon | R | 31.1 points | matched | missed |
| 1964 | Barry Goldwater | R | 2.3 points | missed | missed |
| 1968 | Richard Nixon | R | 31.6 points | matched | matched |
| 1972 | Richard Nixon | R | 43.5 points | matched | matched |
| 1976 | Gerald Ford | R | 23.2 points | missed | missed |
| 1980 | Ronald Reagan | R | 36.1 points | matched | matched |
| 1984 | Ronald Reagan | R | 46.5 points | matched | matched |
| 1988 | George H.W. Bush | R | 38.5 points | matched | matched |
| 1992 | George H.W. Bush | R | 24.4 points | missed | missed |
| 1996 | Robert Dole | R | 20.0 points | missed | missed |
| 2000 | George W. Bush | R | 33.4 points | matched | matched |
| 2004 | George W. Bush | R | 32.7 points | matched | matched |
| 2008 | John McCain | R | 20.7 points | missed | missed |
| 2012 | Mitt Romney | R | 24.0 points | missed | missed |
| 2016 | Donald Trump | R | 37.5 points | matched | matched |
| 2020 | Donald J Trump | R | 39.5 points | matched | missed |
| 2024 | Donald J Trump | R | 44.1 points | matched | matched |
Year by year, 1852 to 2024
Newest first. Rank is the county's place among Ohio's counties that year from most Republican (1) to most Democratic, by lean. Lincoln's 1864 National Union ticket is counted as Republican and Horace Greeley's 1872 Liberal Republican ticket, which the Democrats also nominated, as Democratic; 1852 had no Republican ticket, so it has no lean or rank.
| Year | Carried by | Party | Share | Runner-up | Margin | Lean | Ohio | Rank | With Ohio | With the nation |
|---|---|---|---|---|---|---|---|---|---|---|
| 2024 | Donald J Trump | Republican | 71.6% | Kamala D Harris | 44.1 | R+44.1 | R+11.2 | 45 | Yes | Yes |
| 2020 | Donald J Trump | Republican | 68.98% | Joseph R Biden Jr. | 39.5 | R+39.5 | R+8.0 | 51 | Yes | No |
| 2016 | Donald Trump | Republican | 66.43% | Hillary Clinton | 37.5 | R+37.5 | R+8.1 | 47 | Yes | Yes |
| 2012 | Mitt Romney | Republican | 61.16% | Barack Obama | 24.0 | R+24.0 | D+3.0 | 24 | No | No |
| 2008 | John McCain | Republican | 59.57% | Barack Obama | 20.7 | R+20.7 | D+4.6 | 27 | No | No |
| 2004 | George W. Bush | Republican | 66.13% | John Kerry | 32.7 | R+32.7 | R+2.1 | 14 | Yes | Yes |
| 2000 | George W. Bush | Republican | 65.41% | Al Gore | 33.5 | R+33.5 | R+3.5 | 11 | Yes | Yes |
| 1996 | Robert Dole | Republican | 55.35% | Bill Clinton | 20.0 | R+20.0 | D+6.4 | 8 | No | No |
| 1992 | George H.W. Bush | Republican | 53.48% | Bill Clinton | 24.4 | R+24.4 | D+1.8 | 7 | No | No |
| 1988 | George H.W. Bush | Republican | 68.97% | Michael Dukakis | 38.5 | R+38.5 | R+10.8 | 18 | Yes | Yes |
| 1984 | Ronald Reagan | Republican | 72.98% | Walter F. Mondale | 46.5 | R+46.5 | R+18.8 | 25 | Yes | Yes |
| 1980 | Ronald Reagan | Republican | 65.84% | Jimmy Carter | 36.1 | R+36.1 | R+10.6 | 8 | Yes | Yes |
| 1976 | Gerald Ford | Republican | 60.56% | Jimmy Carter | 23.2 | R+23.2 | D+0.2 | 7 | No | No |
| 1972 | Richard Nixon | Republican | 69.96% | George McGovern | 43.5 | R+43.5 | R+21.6 | 17 | Yes | Yes |
| 1968 | Richard Nixon | Republican | 60.3% | Hubert Humphrey | 31.6 | R+31.6 | R+2.3 | 7 | Yes | Yes |
| 1964 | Barry Goldwater | Republican | 51.17% | Lyndon B. Johnson | 2.3 | R+2.3 | D+25.9 | 3 | No | No |
| 1960 | Richard Nixon | Republican | 65.54% | John F. Kennedy | 31.1 | R+31.1 | R+6.6 | 23 | Yes | No |
| 1956 | Dwight D. Eisenhower | Republican | 70.22% | Adlai E. Stevenson | 40.4 | R+40.4 | R+22.2 | 23 | Yes | Yes |
| 1952 | Dwight D. Eisenhower | Republican | 65.12% | Adlai Stevenson | 30.2 | R+30.2 | R+13.5 | 34 | Yes | Yes |
| 1948 | Thomas E. Dewey | Republican | 56.67% | Harry S. Truman | 13.8 | R+13.8 | D+0.2 | 32 | No | No |
| 1944 | Thomas E. Dewey | Republican | 62.59% | Franklin D. Roosevelt | 25.2 | R+25.2 | R+0.4 | 28 | Yes | No |
| 1940 | Wendell Willkie | Republican | 58.83% | Franklin D. Roosevelt | 17.7 | R+17.7 | D+4.4 | 28 | No | No |
| 1936 | Franklin D. Roosevelt | Democratic | 49.12% | Alf Landon | 4.2 | D+4.2 | D+20.6 | 32 | Yes | Yes |
| 1932 | Franklin D. Roosevelt | Democratic | 52.23% | Herbert Hoover | 6.3 | D+6.3 | D+2.9 | 54 | Yes | Yes |
| 1928 | Herbert Hoover | Republican | 68.21% | Al Smith | 37.0 | R+37.0 | R+30.4 | 45 | Yes | Yes |
| 1924 | Calvin Coolidge | Republican | 61.76% | John W. Davis | 32.8 | R+32.8 | R+34.6 | 37 | Yes | Yes |
| 1920 | Warren G. Harding | Republican | 53.59% | James M. Cox | 8.9 | R+8.9 | R+19.9 | 66 | Yes | Yes |
| 1916 | Woodrow Wilson | Democratic | 55.91% | Charles Evans Hughes | 15.5 | D+15.5 | D+7.7 | 63 | Yes | Yes |
| 1912 | Woodrow Wilson | Democratic | 48.21% | William Howard Taft | 25.9 | D+25.9 | D+14.1 | 67 | Yes | Yes |
| 1908 | William Jennings Bryan | Democratic | 53.07% | William Howard Taft | 10.0 | D+10.0 | R+6.2 | 68 | No | No |
| 1904 | Theodore Roosevelt | Republican | 52.5% | Alton B. Parker | 9.6 | R+9.6 | R+25.4 | 63 | Yes | Yes |
| 1900 | William Jennings Bryan | Democratic | 54.42% | William McKinley | 10.5 | D+10.5 | R+6.6 | 71 | No | No |
| 1896 | William Jennings Bryan | Democratic | 55.46% | William McKinley | 12.4 | D+12.4 | R+4.8 | 72 | No | No |
| 1892 | Grover Cleveland | Democratic | 53.26% | Benjamin Harrison | 14.7 | D+14.7 | R+0.1 | 74 | No | Yes |
| 1888 | Grover Cleveland | Democratic | 55.94% | Benjamin Harrison | 14.9 | D+14.9 | R+2.3 | 75 | No | No |
| 1884 | Grover Cleveland | Democratic | 56.21% | James G. Blaine | 13.5 | D+13.5 | R+4.0 | 73 | No | Yes |
| 1880 | Winfield Scott Hancock | Democratic | 56.81% | James A. Garfield | 14.4 | D+14.4 | R+4.7 | 75 | No | No |
| 1876 | Samuel J. Tilden | Democratic | 58.47% | Rutherford B. Hayes | 17.2 | D+17.2 | R+1.1 | 74 | No | No |
| 1872 | Horace Greeley | Liberal Republican | 54.66% | Ulysses S. Grant | 10.1 | D+10.1 | R+7.1 | 70 | No | No |
| 1868 | Horatio Seymour | Democratic | 57.85% | Ulysses S. Grant | 15.7 | D+15.7 | R+8.0 | 75 | No | No |
| 1864 | George B. McClellan | Democratic | 54.39% | Abraham Lincoln | 8.8 | D+8.8 | R+12.7 | 75 | No | No |
| 1860 | Stephen A. Douglas | Democratic | 50.48% | Abraham Lincoln | 2.3 | D+2.3 | R+10.0 | 66 | No | No |
| 1856 | James Buchanan | Democratic | 49.98% | John C. Frémont | 3.1 | D+3.1 | R+4.3 | 56 | No | Yes |
| 1852 | Franklin Pierce | Democratic | 61.03% | Winfield Scott | 23.0 | — | — | — | Yes | Yes |
Turnout, 1996-2024
Ballots cast in the November general election per registered voter, as the Ohio Secretary of State reports them. This record holds county turnout from 1996 on.
| Year | Registered | Ballots cast | Turnout |
|---|---|---|---|
| 2024 | 66,199 | 46,845 | 70.76% |
| 2020 | 67,374 | 48,353 | 71.77% |
| 2016 | 68,054 | 46,735 | 68.67% |
| 2012 | 69,525 | 48,708 | 70.06% |
| 2008 | 70,628 | 50,943 | 72.13% |
| 2004 | 68,151 | 49,929 | 73.26% |
| 2000 | 67,950 | 44,207 | 65.06% |
| 1996 | 60,170 | 44,636 | 74.18% |
Sources
Data from Wikipedia, CC BY-SA 4.0: 1852 United States presidential election in Ohio · 1856 United States presidential election in Ohio · 1860 United States presidential election in Ohio · 1864 United States presidential election in Ohio · 1868 United States presidential election in Ohio · 1872 United States presidential election in Ohio · 1876 United States presidential election in Ohio · 1880 United States presidential election in Ohio · 1884 United States presidential election in Ohio · 1888 United States presidential election in Ohio · 1892 United States presidential election in Ohio · 1896 United States presidential election in Ohio · 1900 United States presidential election in Ohio · 1904 United States presidential election in Ohio · 1908 United States presidential election in Ohio · 1912 United States presidential election in Ohio · 1916 United States presidential election in Ohio · 1920 United States presidential election in Ohio · 1924 United States presidential election in Ohio · 1928 United States presidential election in Ohio · 1932 United States presidential election in Ohio · 1936 United States presidential election in Ohio · 1940 United States presidential election in Ohio · 1944 United States presidential election in Ohio · 1948 United States presidential election in Ohio · 1952 United States presidential election in Ohio · 1956 United States presidential election in Ohio · 1960 United States presidential election in Ohio · 1964 United States presidential election in Ohio · 1968 United States presidential election in Ohio · 1972 United States presidential election in Ohio · 1976 United States presidential election in Ohio · 1980 United States presidential election in Ohio
- oh_1984_general_president_county.xlsx -- Ohio Secretary of State Past Election Results portal · Ohio Secretary of State · 1984-11-06 · accessed 2026-09-17
- County Presidential Election Returns 2000-2024 (V20) · MIT Election Data and Science Lab (MEDSL), Harvard Dataverse · 2000-11-07 · accessed 2026-09-17
- U.S. Electoral College results by year · National Archives and Records Administration
Cite and data
Cite this page as:
Cracked Buckeye, "Allen County in presidential elections, 1852-2024", https://crackedbuckeye.com/county/allen/president/, built 2026-10-19, accessed [date].
How to cite · Report a correction · Built 2026-10-19