Water system
Circleville City
EPA ID OH6500412 · Pickaway County · 13,927 people served · owned by a local government
Circleville City treats its own water from Scioto River valley aquifer (sand & gravel wells).
The system's record
- Aquifer
- Scioto River valley aquifer (sand and gravel outwash)
- Water bodies
- Scioto River
- Active wells
- 4
- Serves
- 13,927 people · Pickaway County
- EPA ID
- OH6500412
About this area's water
Did you know
- Circleville's water plant has been worked over four times since it opened in 1962 — upgrades in 1983.
- The wells reach about 130 feet into the Teays aquifer, but the top of that aquifer sits less than 15 feet below the surface under a thin clay cover.
- The city finished an emergency backup connection to the Earnhart Hill system in June 2015 and, in 2025, did not draw a single gallon through it.
- Circleville sells water by the hundred cubic feet, and the arithmetic matters: at $6.66 per ccf plus an $8.50 service charge, 5,000 gallons costs about $53 a month.
History6
- 1962Water treatment plant built west of the city, alongside the well field.
- 1983Water treatment plant upgraded.
- 1990Water treatment plant expanded.
- 2012Water treatment plant upgraded again.
- 2015June: emergency backup water system interconnection with the Earnhart Hill Water system completed, for emergency use only.
- 2022Ohio EPA issued a finding of no significant impact for a $41.6 million wastewater plant upgrade financed through the Water Pollution Control Loan Fund.
Treatment & pressure
How it is treated
Four production wells, each averaging about 130 feet deep, draw from the Teays valley sand-and-gravel aquifer at the water plant site at 663 Island Road, west of the city.
Source: circlevilleoh.govcirclevilleoh.govsciotopost.com
Water pressure
The 2025 CCR and the Ohio EPA environmental reviews reviewed here give no distribution pressure figure.
What it costs
$8.90 per 1,000 gallons
Typical household bill about $53 a month for water.
2026 schedule, inside the city: $8.50 monthly service charge plus $6.66 per 100 cubic feet at every tier.
Water quality & impurities7
| Contaminant | Level | Limit | Year |
|---|---|---|---|
| Total Chlorine Range 0.99-1.27; disinfectant residual, compliant. | 1.16 ppm | 4.0 (MRDL) | 2025 |
| Total Trihalomethanes (TTHM) Range 33.0-33.6; disinfection byproduct, compliant. | 33.6 ppb | 80 | 2025 |
| Haloacetic Acids (HAA5) Range 6.4-6.9; disinfection byproduct, compliant. | 6.9 ppb | 60 | 2025 |
| Fluoride Range 0.83-1.15; well under the MCL. | 1.10 ppm | 4 | 2025 |
| Copper 90th percentile, range of individual results 0.00-1.2; 0 of 30 samples over the action level. | 0.780 ppm | 2025 | |
| Barium Naturally occurring; compliant. | 0.13 ppm | 2 | 2025 |
| Alpha emitters Erosion of natural deposits; monitored less than annually. | 4.86 pCi/L | 15 | 2022 |
Source: circlevilleoh.gov
EPA compliance record
Lead at the tap: 90th-percentile result 0 ppb in 2025 (action level 15 ppb).
EPA record: no health-based violations since 2015.
Projects & plans6
Recent and current work
- Wastewater treatment plant upgrade · $42 million · 2022 · under construction
Ohio EPA Water Pollution Control Loan Fund project, about $37.8 million construction and $3.8 million engineering. - Annual water main flushing program · 2025 · completed
Ongoing operating program rather than a capital job; the 2025 CCR says it was initiated to significantly reduce instances of discolored water. - Lead service line inventory · 2024-2025 · completed
Required under the Lead and Copper Rule. - Walnut Street utility improvements (water main replacement) · $1.3 million · 2026 · planned
- Trunk sewer regionalization design · 2026 · planned
Council passed emergency resolution 08.47-2026 on August 4, 2026 authorizing a Water Pollution Control Loan Fund design loan.
Source: circlevilleoh.govcirclevilleoh.govcirclevilleoh.gov
Planned or needed
- Water treatment plant rebuild with reverse-osmosis membranes · $56 million · 2030 · proposed
Source: sciotopost.com
Supply stress
Ohio EPA's source water assessment rates the aquifer as having high susceptibility to contamination, on three grounds: a minimal thickness of protective clay above the aquifer, a shallow aquifer top less than 15 feet below ground surface, and significant potential contaminant sources inside the required protection area.
Sewers
Sanitary
City-owned wastewater treatment plant west of the city, rated at 4.0 MGD and handling about 2.0 MGD in dry weather, discharging to the Scioto River at river mile 99.2 — a reach designated warmwater habitat and a superior high quality water resource — and serving about 13,000 people.
Source: circlevilleoh.govcirclevilleoh.govsciotovalleyguardian.com
Serves
Main water supplier in 1 ZIP code
- 43113 · Circleville50% of residents
Population-weighted resident shares; a ZIP code can have more than one system on record. Recomputed from each ZIP's own system list, not from the map's cached footprint.
Buys from · Sells to
Circleville City does not buy water from another system on record; it treats its own source water.
No other system is on record buying water from Circleville City.
What the records show about Circleville City
Who runs it
EPA's record describes Circleville City as owned by a local government. It has 5,292 service connections and serves 13,927 people.
EPA classes it as a community water system, one that serves the same residents all year.
EPA's record says it has substantially implemented source water protection under Ohio's program, dating the program from 2023. Its office telephone on EPA's record is 740-477-8242.
Source: EPA Safe Drinking Water Information System (SDWIS), water system record.
How the water is treated
EPA's treatment table registers these steps for Circleville City: aeration, corrosion control, chlorine disinfection, fluoridation, and sand or media filtration.
The list is what each system registered with EPA for treatment plants EPA still shows as active, and it can lag a plant upgrade.
Source: EPA Safe Drinking Water Information System (SDWIS) treatment table (EPA Envirofacts, pulled September 2026).
Violations
EPA's record shows no health-based violations for Circleville City since 2015.
EPA logs no violations of any kind for Circleville City since 2020.
Source: EPA Safe Drinking Water Information System (SDWIS) violation records: health-based violations with compliance periods beginning in 2015 or later, all violations from 2020 or later (EPA Envirofacts, pulled November 2026).
Lead and copper at the tap
For the sampling period ending December 2025, EPA's record lists the 90th-percentile lead result at Circleville City as 0 ppb, under both the current 15 ppb action level and the 10 ppb level that applies from 2027. EPA records a result below the lab's reporting level as 0, so this is the result reported, not proof that no home sampled had lead.
EPA has 8 sampling periods on file for Circleville City since 2016, the first ending in 2018; no period was above 10 ppb.
Every water system has to inventory its service lines, the pipes from the main to each building. In the inventory Circleville City sent EPA, 5,482 lines are counted.
| Material | Lines |
|---|---|
| Lead | 11 |
| Galvanized, needing replacement | 459 |
| Unknown material | 1,213 |
| Not lead | 3,799 |
| All lines | 5,482 |
Systems sample taps in the homes most likely to have lead pipes or solder. The 90th-percentile result is the level nine in ten of the sampled homes were at or below. Lead comes mostly from service lines and house plumbing, not the source water, so a low result for the system does not clear an old house.
EPA's dashboard status for this inventory: reported all required service line types.
Source: EPA Safe Drinking Water Information System (SDWIS) lead and copper 90th-percentile results (EPA Envirofacts), sampling periods ending 2016 or later; EPA's service line inventory dashboard, Ohio's 2026 Q2 submission.
PFAS
EPA's fifth national round of testing (UCMR 5) took 2 samples of the water entering the pipes of Circleville City in 2023 to 2024 and measured 29 PFAS. EPA's UCMR 5 file shows no PFAS detected, PFOA and PFOS (federal limit 4 ng/L each) among them.
Ohio EPA's own statewide sampling tested 1 plant of Circleville City (latest sample August 2020). Not one of the six PFAS tested (PFOA, PFOS, PFHxS, PFNA, GenX and PFBS) was detected.
Ohio EPA's current sampling status map lists 1 plant of Circleville City as sampled, most recently May 2026.
PFAS are the 'forever chemicals' from firefighting foam, plating shops and non-stick coatings. Results are for water leaving the plant, not your tap.
Source: EPA UCMR 5 occurrence data (final release, August 2026); Ohio EPA statewide PFAS sampling, 2019 to 2021, and its sampling status map.
Disinfection byproducts
Chlorine that disinfects water also reacts with organic matter to form byproducts. Two groups have federal limits: total trihalomethanes (TTHM, 80 µg/L) and five haloacetic acids (HAA5, 60 µg/L), judged on running yearly averages at each sampling site.
For TTHM, the average of Circleville City's samples in 2019, the last year it was sampled, was 21.4 µg/L. The worst yearly average was 34.5 µg/L and the highest single sample was 44 µg/L, from 62 samples taken from 2012 to 2019.
For HAA5, the average in the last year sampled was 3.7 µg/L. The worst yearly average was 9.3 µg/L and the highest single sample was 11 µg/L, from 62 samples.
| Byproduct | Limit | Latest yearly average | Worst yearly average | Highest sample | Samples |
|---|---|---|---|---|---|
| TTHM | 80 µg/L | 21.4 µg/L (2019) | 34.5 µg/L | 44 µg/L | 62 |
| HAA5 | 60 µg/L | 3.7 µg/L | 9.3 µg/L | 11 µg/L | 62 |
A yearly average of 0 means nothing was detected in that year's samples. EPA's file stops at 2019; Ohio EPA's Drinking Water Watch has newer results.
Source: EPA Six-Year Review 4 compliance monitoring data, 2012 to 2019, distribution-system samples (non-detects counted as zero).
Nitrate, arsenic and radioactivity
Nitrate was not detected in 8 samples through 2019 (limit 10 mg/L as nitrogen; above 10 is unsafe for infants).
Arsenic was not detected in 4 samples (limit 10 µg/L).
| Contaminant | Samples | Highest result | Limit | Samples over limit |
|---|---|---|---|---|
| Nitrate (as nitrogen) | 8 | not detected | 10 mg/L | 0 |
| Arsenic | 4 | not detected | 10 µg/L | 0 |
| Combined radium | 1 | not detected | 5 pCi/L | 0 |
Measured in finished water: at the plant's entry points and in the distribution system; raw well and intake samples are left out. Non-detects count as zero.
Source: EPA Six-Year Review 4 compliance monitoring data, 2012 to 2019, finished water.
Solvents and fuels
EPA's file holds results for all six solvent and fuel compounds it checked. Benzene, carbon tetrachloride, 1,2-dichloroethane, trichloroethylene, tetrachloroethylene, and vinyl chloride were not detected in 3 samples each.
| Compound | Limit | Samples | Detected in | Highest result | Samples over limit |
|---|---|---|---|---|---|
| Benzene | 5 µg/L | 3 | 0 of 3 | not detected | 0 |
| Carbon tetrachloride | 5 µg/L | 3 | 0 of 3 | not detected | 0 |
| 1,2-dichloroethane | 5 µg/L | 3 | 0 of 3 | not detected | 0 |
| Trichloroethylene (TCE) | 5 µg/L | 3 | 0 of 3 | not detected | 0 |
| Tetrachloroethylene (PCE) | 5 µg/L | 3 | 0 of 3 | not detected | 0 |
| Vinyl chloride | 2 µg/L | 3 | 0 of 3 | not detected | 0 |
"Not detected" means the lab's result was below what its method can measure, not that the compound is absent. Non-detects count as zero in the highest-result column.
Source: EPA Six-Year Review 4 compliance monitoring data, 2012 to 2019, finished water.
Farm chemicals and metals
EPA's file holds results for 8 of the nine herbicides and metals it checked. Detected: barium in 3 of 3 samples, highest 158 µg/L (limit 2,000). Not detected: atrazine in 2 samples, alachlor in 2 samples, chromium in 8 samples, cadmium in 8 samples, mercury in 3 samples, selenium in 3 samples, thallium in 3 samples.
| Substance | Kind | Limit | Samples | Detected in | Highest result | Samples over limit |
|---|---|---|---|---|---|---|
| Atrazine | Farm chemical | 3 µg/L | 2 | 0 of 2 | not detected | 0 |
| Alachlor | Farm chemical | 2 µg/L | 2 | 0 of 2 | not detected | 0 |
| Chromium | Metal | 100 µg/L | 8 | 0 of 8 | not detected | 0 |
| Cadmium | Metal | 5 µg/L | 8 | 0 of 8 | not detected | 0 |
| Barium | Metal | 2,000 µg/L | 3 | 3 of 3 | 158 µg/L | 0 |
| Mercury | Metal | 2 µg/L | 3 | 0 of 3 | not detected | 0 |
| Selenium | Metal | 50 µg/L | 3 | 0 of 3 | not detected | 0 |
| Thallium | Metal | 2 µg/L | 3 | 0 of 3 | not detected | 0 |
Non-detects count as zero in the highest-result column.
Source: EPA Six-Year Review 4 compliance monitoring data, 2012 to 2019, finished water.
Bacteria in the pipes
From 2012 to 2019, 10 of 1,439 routine total coliform samples taken in the distribution system at Circleville City tested positive (0.69%); in 2019, the last year on file, 2 of 179 did. E. coli was found in 2 of 21 samples tested for it.
A positive coliform test is a warning sign, not a violation by itself. E. coli is a sign that human or animal waste may have reached the water. Coliform counts are routine samples only; E. coli counts include repeat samples.
Source: EPA Six-Year Review 4 compliance monitoring data, 2012 to 2019, distribution-system presence/absence tests for total coliform and E. coli.
Fluoride
The Ohio Department of Health's report to the CDC (My Water's Fluoride) says Circleville City adjusts the fluoride level to the recommended level for preventing tooth decay.
EPA's treatment table lists fluoridation among the steps at Circleville City.
Measured fluoride: 0.94 mg/L on average at the plant's entry points in 2019 (above the 0.7 mg/L level now recommended and well under the 4 mg/L limit); samples ran from 0.94 to 1.19 mg/L across 3 samples in 2012 to 2019.
The recommended level for preventing tooth decay is 0.7 mg/L; the federal limit is 4 mg/L. The treatment list is what each system registered with EPA and can lag a plant upgrade.
Source: CDC My Water's Fluoride (fluoridation status as reported by the Ohio Department of Health, fetched September 2026); EPA Safe Drinking Water Information System (SDWIS) treatment table; EPA Six-Year Review 4 compliance monitoring data, 2012 to 2019, entry-point fluoride samples.
Lithium
Lithium was found in 2 of 2 UCMR 5 samples at Circleville City, highest 10.9 µg/L; detections averaged 10.3, last sampled in 2024.
Lithium is not regulated. EPA's draft health reference level is 10 µg/L, and it occurs naturally in deep groundwater, so well systems in the northwest run highest.
Source: EPA UCMR 5 occurrence data (final release, August 2026), samples from 2023 to 2025.
Water and sewer bills
Ohio EPA's 2023 rate survey puts the water bill at Circleville City for a household using 5,000 gallons a month at $467 a year, about $39 a month.
| Use | Water, per year | Sewer, per year |
|---|---|---|
| 2,500 gallons a month | $263 | not on file |
| 5,000 gallons a month | $467 | not on file |
| 8,000 gallons a month | $711 | not on file |
The survey lists it as “Circleville”. These are inside-city rates and annual bills at the use shown.
Source: Ohio EPA 2023 Sewer and Water Rate Survey (Ohio State University, May 2025).
How well the service area is mapped
The service area drawn on the map for Circleville City comes from the utility's own map.
Counting the people who live in the ZIP codes it overlaps, this atlas estimates 12,135 residents are inside the boundary, 87% of the 13,927 people Circleville City reports serving.
The resident count is an estimate from 2020 Census ZIP-code populations, not a count of customers.
Source: EPA Service Area Boundaries; resident estimate by this atlas from ZIP-code overlap.
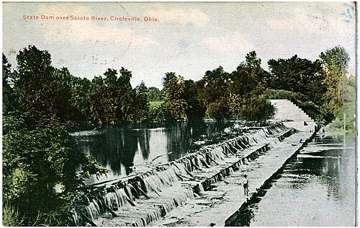
Photograph
On the map
Show this system's territory on the map — 1 ZIP code in all.
Sources
U.S. EPA SDWIS and Community Water System Service Area Boundaries (v3, 2026), Ohio EPA primacy data, 2020 census blocks: the system serving most residents, traced through purchases to the treating utility; Ohio EPA 2023 Sewer and Water Rate Survey (Ohio State, May 2025) for household bills; Ohio EPA DEFA loan awards since 2016 for the loans paragraph · EPA SDWIS · EPA service area boundaries · Ohio EPA drinking water · Ohio EPA rate survey
EPA's own record for this system: Enforcement and Compliance History report for OH6500412 (EPA ECHO).
Circleville City's own pages: sciotopost.com, etd.ohiolink.edu
Notable facts: circlevilleoh.gov, circlevilleoh.gov, circlevilleoh.gov, sciotopost.com
History: circlevilleoh.gov, circlevilleoh.gov, circlevilleoh.gov, sciotopost.com
Water quality: circlevilleoh.gov
Planned work: sciotopost.com
Capital projects: circlevilleoh.gov, circlevilleoh.gov, circlevilleoh.gov, sciotovalleyguardian.com
Rates: circlevilleoh.gov, sciotopost.com, recordherald.com
Sewers: circlevilleoh.gov, circlevilleoh.gov, sciotovalleyguardian.com
Treatment: circlevilleoh.gov, circlevilleoh.gov, sciotopost.com
Supply stress: circlevilleoh.gov, circlevilleoh.gov, circlevilleoh.gov, sciotopost.com