Water system
Lithopolis Village
EPA ID OH2301112 · Fairfield County · 1,573 people served · owned by a local government
Lithopolis Village treats its own water from Groundwater wells (3 wells).
The system's record
- Active wells
- 3
- Serves
- 1,573 people · Fairfield County
- EPA ID
- OH2301112
About this area's water
Did you know
- The name Lithopolis is Greek for 'stone city,' a nod to a limestone quarry near the original townsite (originally platted as Centerville in 1815).
- The village maintains an emergency interconnect with the Canal Winchester water system that, per the 2025 CCR, 'has not yet been used to supply water to Lithopolis residents.'
- Lithopolis's population grew 92.9% between 2010 and 2020 (1,106 to 2,134), among the faster growth rates for a small Ohio village, adding pressure to a water system drawing from a shallow, contamination-prone aquifer.
Source: lithopolis.orgen.wikipedia.org
History5
- 1815Village laid out under the original name Centerville, near a stone quarry.
- 1827A post office opens under the name Lithopolis, Greek for 'stone city.'
- 2003Ohio EPA source water assessment finds the village's shallow sand-and-gravel aquifer has 'high susceptibility to contamination,' prompting a Wellhead Protection Ordinance (19-11).
- 2010-2020Population grows 92.9% (1,106 to 2,134) per U.S. Census, as the village suburbanizes.
- 2022-2023Village performs comprehensive maintenance on all three wells: pumps and discharge pipes replaced, wells cleaned and sterilized.
Source: en.wikipedia.orglithopolis.org
Treatment & pressure
How it is treated
Groundwater from three wells in a sand-and-gravel aquifer covered by only ~10 ft of low-permeability material, with depth to water under 15 ft. Treatment and storage capacity is 500,000 gallons/day; chlorine disinfection is used (total chlorine residual 1.22 ppm, range 0.8-1.7 in 2025). The 2025 CCR describes no filtration step beyond well pumping and disinfection.
Source: lithopolis.orglithopolis.org
What it costs
$7.73 per 1,000 gallons
In-town residential water rate is $7.73/1,000 gal; out-of-town customers pay $11.21/1,000 gal. Separate sewer ($9.08/1,000 gal in-town, $13.17 out-of-town) and a flat $5.00/month stormwater charge also apply.
Source: lithopolis.org
Water quality & impurities8
| Contaminant | Level | Limit | Year |
|---|---|---|---|
| Total Trihalomethanes (TTHM) Range 2.6-15.5 ppb; disinfection byproduct, no violation. | 15.5 ppb | 80 | 2025 |
| Haloacetic Acids (HAA5) Not detected above reporting limit. | <6 ppb | 60 | 2025 |
| Total Chlorine Range 0.8-1.7 ppm; disinfectant residual. | 1.22 ppm | 4 (MRDL) | 2025 |
| Arsenic Naturally occurring; well below MCL. | 0.9 ppb | 10 | 2023 |
| Barium Naturally occurring. | 0.547 ppm | 2 | 2023 |
| Fluoride Naturally occurring. | 0.38 ppm | 4 | 2023 |
| Lead (90th percentile) 0 of 10 samples exceeded action level; no lead service lines in system. | 3.1 ppb | 15 (AL) | 2025 |
| Copper (90th percentile) 0 of 10 samples exceeded action level. | 0.145 ppm | 1.3 (AL) | 2025 |
Source: lithopolis.org
EPA compliance record
Lead at the tap: 90th-percentile result 3.1 ppb in 2025 (action level 15 ppb).
EPA health-based violations since 2015:
- 2024Lead and Copper Rule Revisions · lead service line inventory missing or incomplete (a records requirement, not a lead test result) · returned to compliance
14 violations of any kind logged since 2020: 4 for required testing that was missed or reported late; 9 for a report, record or notice that was missing, late or incomplete (the yearly water quality report, a public notice, lead line records); 1 health-based.
Projects & plans1
Recent and current work
- Well field rehabilitation (all 3 wells) · 2022-2023 · completed
Pumps and discharge pipes replaced; wells cleaned and sterilized.
Source: lithopolis.org
Supply stress
Aquifer is shallow (<15 ft) with only ~10 ft of low-permeability cover, rated 'high susceptibility to contamination' in the village's 2003 Ohio EPA source water assessment; the village relies on a Wellhead Protection Ordinance and participation in the Fairfield County Regional Drinking Water Source Protection Plan rather than treatment redundancy. Rapid population growth (92.9% 2010-2020) adds demand pressure on a system built for a much smaller town.
Source: lithopolis.org
Sewers
Sanitary
Village operates its own sanitary sewer utility, billed alongside water ($9.08/1,000 gal in-town, $13.17 out-of-town).
Storm
A separate $5.00/month stormwater charge is billed, indicating a distinct stormwater utility.
Source: lithopolis.org
Serves
Main water supplier in 1 ZIP code
- 43136 · Lithopolis98% of residents
Also present in 1 more ZIP code
- 43110 · Columbus and Canal Winchester0% of residents
Population-weighted resident shares; a ZIP code can have more than one system on record. Recomputed from each ZIP's own system list, not from the map's cached footprint.
Buys from · Sells to
Lithopolis Village does not buy water from another system on record; it treats its own source water.
No other system is on record buying water from Lithopolis Village.
What the records show about Lithopolis Village
Who runs it
EPA's record describes Lithopolis Village as owned by a local government. It has 778 service connections and serves 1,573 people.
EPA classes it as a community water system, one that serves the same residents all year.
Its office telephone on EPA's record is 614-837-2031.
Source: EPA Safe Drinking Water Information System (SDWIS), water system record.
How the water is treated
EPA's treatment table registers these steps for Lithopolis Village: aeration, chlorine disinfection, iron and manganese removal, and ion-exchange softening.
The list is what each system registered with EPA for treatment plants EPA still shows as active, and it can lag a plant upgrade.
Source: EPA Safe Drinking Water Information System (SDWIS) treatment table (EPA Envirofacts, pulled September 2026).
Violations
EPA counts 1 health-based violation for Lithopolis Village since 2015. Health-based means a contaminant above its legal limit or a required treatment step not carried out. It falls into 1 separate problem (one contaminant or rule in one year); the table lists it.
EPA logs 14 violations of any kind since 2020: 4 for required testing that was missed or reported late; 9 for a report, record or notice that was missing, late or incomplete (the yearly water quality report, a public notice, lead line records); 1 health-based.
| Year | Contaminant or rule | Kind | Measured | Limit | Status in EPA's record |
|---|---|---|---|---|---|
| 2024 | Lead and Copper Rule Revisions | lead service line inventory missing or incomplete (a records requirement, not a lead test result) | not on file | not on file | returned to compliance |
Source: EPA Safe Drinking Water Information System (SDWIS) violation records: health-based violations with compliance periods beginning in 2015 or later, all violations from 2020 or later (EPA Envirofacts, pulled November 2026).
Lead and copper at the tap
In the sampling period ending December 2025, the 90th-percentile lead result at Lithopolis Village was 3.1 ppb, under both the current 15 ppb action level and the 10 ppb level that applies from 2027.
EPA has 9 sampling periods on file for Lithopolis Village since 2016, the first ending in 2016; no period was above 10 ppb.
Every water system has to inventory its service lines, the pipes from the main to each building. In the inventory Lithopolis Village sent EPA, 1,188 lines are counted.
| Material | Lines |
|---|---|
| Lead | 0 |
| Galvanized, needing replacement | 0 |
| Unknown material | 0 |
| Not lead | 1,188 |
| All lines | 1,188 |
Systems sample taps in the homes most likely to have lead pipes or solder. The 90th-percentile result is the level nine in ten of the sampled homes were at or below. Lead comes mostly from service lines and house plumbing, not the source water, so a low result for the system does not clear an old house.
EPA's dashboard status for this inventory: reported all required service line types.
Source: EPA Safe Drinking Water Information System (SDWIS) lead and copper 90th-percentile results (EPA Envirofacts), sampling periods ending 2016 or later; EPA's service line inventory dashboard, Ohio's 2026 Q2 submission.
PFAS
Ohio EPA's own statewide sampling tested 1 plant of Lithopolis Village (latest sample August 2020). Not one of the six PFAS tested (PFOA, PFOS, PFHxS, PFNA, GenX and PFBS) was detected.
Ohio EPA's current sampling status map lists 1 plant of Lithopolis Village as sampled, most recently June 2026.
PFAS are the 'forever chemicals' from firefighting foam, plating shops and non-stick coatings. Results are for water leaving the plant, not your tap.
Source: EPA UCMR 5 occurrence data (final release, August 2026); Ohio EPA statewide PFAS sampling, 2019 to 2021, and its sampling status map.
Disinfection byproducts
Chlorine that disinfects water also reacts with organic matter to form byproducts. Two groups have federal limits: total trihalomethanes (TTHM, 80 µg/L) and five haloacetic acids (HAA5, 60 µg/L), judged on running yearly averages at each sampling site.
For TTHM, the average of Lithopolis Village's samples in 2019, the last year it was sampled, was 16.2 µg/L. The worst yearly average was 22.2 µg/L and the highest single sample was 25.3 µg/L, from 11 samples taken from 2014 to 2019.
For HAA5, the average in the last year sampled was 0 µg/L. The worst yearly average was 0 µg/L and the highest single sample was 0 µg/L, from 11 samples.
| Byproduct | Limit | Latest yearly average | Worst yearly average | Highest sample | Samples |
|---|---|---|---|---|---|
| TTHM | 80 µg/L | 16.2 µg/L (2019) | 22.2 µg/L | 25.3 µg/L | 11 |
| HAA5 | 60 µg/L | 0 µg/L | 0 µg/L | 0 µg/L | 11 |
A yearly average of 0 means nothing was detected in that year's samples. EPA's file stops at 2019; Ohio EPA's Drinking Water Watch has newer results.
Source: EPA Six-Year Review 4 compliance monitoring data, 2012 to 2019, distribution-system samples (non-detects counted as zero).
Nitrate, arsenic and radioactivity
Nitrate: the highest of 8 samples was 0.14 mg/L (as nitrogen) in 2013; in 2019, the last year sampled, nitrate was not detected. No sample was over the limit of 10 mg/L. Nitrate above 10 is unsafe for infants.
Arsenic was not detected in 2 samples (limit 10 µg/L).
| Contaminant | Samples | Highest result | Limit | Samples over limit |
|---|---|---|---|---|
| Nitrate (as nitrogen) | 8 | 0.14 mg/L | 10 mg/L | 0 |
| Arsenic | 2 | not detected | 10 µg/L | 0 |
| Combined radium | 1 | not detected | 5 pCi/L | 0 |
Measured in finished water: at the plant's entry points and in the distribution system; raw well and intake samples are left out. Non-detects count as zero.
Source: EPA Six-Year Review 4 compliance monitoring data, 2012 to 2019, finished water.
Solvents and fuels
EPA's file holds results for all six solvent and fuel compounds it checked. Benzene, carbon tetrachloride, 1,2-dichloroethane, trichloroethylene, tetrachloroethylene, and vinyl chloride were not detected in 2 samples each.
| Compound | Limit | Samples | Detected in | Highest result | Samples over limit |
|---|---|---|---|---|---|
| Benzene | 5 µg/L | 2 | 0 of 2 | not detected | 0 |
| Carbon tetrachloride | 5 µg/L | 2 | 0 of 2 | not detected | 0 |
| 1,2-dichloroethane | 5 µg/L | 2 | 0 of 2 | not detected | 0 |
| Trichloroethylene (TCE) | 5 µg/L | 2 | 0 of 2 | not detected | 0 |
| Tetrachloroethylene (PCE) | 5 µg/L | 2 | 0 of 2 | not detected | 0 |
| Vinyl chloride | 2 µg/L | 2 | 0 of 2 | not detected | 0 |
"Not detected" means the lab's result was below what its method can measure, not that the compound is absent. Non-detects count as zero in the highest-result column.
Source: EPA Six-Year Review 4 compliance monitoring data, 2012 to 2019, finished water.
Farm chemicals and metals
EPA's file holds results for 8 of the nine herbicides and metals it checked. Detected: barium in 2 of 2 samples, highest 111 µg/L (limit 2,000). Not detected: atrazine, alachlor, chromium, cadmium, mercury, selenium, and thallium, in 2 samples each.
| Substance | Kind | Limit | Samples | Detected in | Highest result | Samples over limit |
|---|---|---|---|---|---|---|
| Atrazine | Farm chemical | 3 µg/L | 2 | 0 of 2 | not detected | 0 |
| Alachlor | Farm chemical | 2 µg/L | 2 | 0 of 2 | not detected | 0 |
| Chromium | Metal | 100 µg/L | 2 | 0 of 2 | not detected | 0 |
| Cadmium | Metal | 5 µg/L | 2 | 0 of 2 | not detected | 0 |
| Barium | Metal | 2,000 µg/L | 2 | 2 of 2 | 111 µg/L | 0 |
| Mercury | Metal | 2 µg/L | 2 | 0 of 2 | not detected | 0 |
| Selenium | Metal | 50 µg/L | 2 | 0 of 2 | not detected | 0 |
| Thallium | Metal | 2 µg/L | 2 | 0 of 2 | not detected | 0 |
Non-detects count as zero in the highest-result column.
Source: EPA Six-Year Review 4 compliance monitoring data, 2012 to 2019, finished water.
Bacteria in the pipes
From 2012 to 2019, 1 of 189 routine total coliform samples taken in the distribution system at Lithopolis Village tested positive (0.53%); in 2019, the last year on file, 0 of 21 did. E. coli was never found in the 1 sample tested for it.
A positive coliform test is a warning sign, not a violation by itself. E. coli is a sign that human or animal waste may have reached the water. Coliform counts are routine samples only; E. coli counts include repeat samples.
Source: EPA Six-Year Review 4 compliance monitoring data, 2012 to 2019, distribution-system presence/absence tests for total coliform and E. coli.
Fluoride
The Ohio Department of Health's report to the CDC (My Water's Fluoride) says Lithopolis Village has fluoride from natural sources, but at a level below what is recommended for preventing tooth decay, and does not adjust it. The level it reports is 0.33 mg/L.
EPA's treatment table lists no fluoridation step at Lithopolis Village.
Measured fluoride: 0.32 mg/L on average at the plant's entry points in 2017 (below the 0.7 mg/L level now recommended); samples ran from 0.32 to 0.35 mg/L across 2 samples in 2012 to 2019.
The recommended level for preventing tooth decay is 0.7 mg/L; the federal limit is 4 mg/L. The treatment list is what each system registered with EPA and can lag a plant upgrade.
Source: CDC My Water's Fluoride (fluoridation status as reported by the Ohio Department of Health, fetched September 2026); EPA Safe Drinking Water Information System (SDWIS) treatment table; EPA Six-Year Review 4 compliance monitoring data, 2012 to 2019, entry-point fluoride samples.
Water and sewer bills
Ohio EPA's 2023 rate survey puts the water bill at Lithopolis Village for a household using 5,000 gallons a month at $464 a year, about $39 a month.
| Use | Water, per year | Sewer, per year |
|---|---|---|
| 2,500 gallons a month | $232 | not on file |
| 5,000 gallons a month | $464 | not on file |
| 8,000 gallons a month | $742 | not on file |
The survey lists it as “Lithopolis”. These are inside-city rates and annual bills at the use shown.
Source: Ohio EPA 2023 Sewer and Water Rate Survey (Ohio State University, May 2025).
How well the service area is mapped
EPA estimated the service area of Lithopolis Village with a computer model rather than drawing it from the utility's map, so its edges are approximate.
Source: EPA Service Area Boundaries; resident estimate by this atlas from ZIP-code overlap.
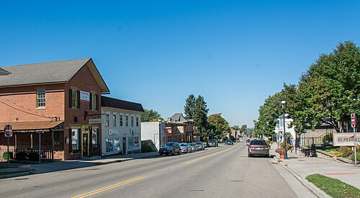
Photograph
On the map
Show this system's territory on the map — 2 ZIP codes in all.
Sources
U.S. EPA SDWIS and Community Water System Service Area Boundaries (v3, 2026), Ohio EPA primacy data, 2020 census blocks: the system serving most residents, traced through purchases to the treating utility; Ohio EPA 2023 Sewer and Water Rate Survey (Ohio State, May 2025) for household bills; Ohio EPA DEFA loan awards since 2016 for the loans paragraph · EPA SDWIS · EPA service area boundaries · Ohio EPA drinking water · Ohio EPA rate survey
EPA's own record for this system: Enforcement and Compliance History report for OH2301112 (EPA ECHO).
Notable facts: lithopolis.org, en.wikipedia.org
History: en.wikipedia.org, lithopolis.org
Water quality: lithopolis.org
Capital projects: lithopolis.org
Rates: lithopolis.org
Sewers: lithopolis.org
Treatment: lithopolis.org, lithopolis.org
Supply stress: lithopolis.org