Water system
Cleveland Public Water System
EPA ID OH1801212 · Cuyahoga County · 1,308,955 people served · owned by a local government
Cleveland Public Water System treats its own water from Lake Erie.
The system's record
- Water bodies
- Lake Erie
- Raw intakes
- Cleveland Baldwin
Cleveland Crown
Cleveland Morgan
Cleveland Nottingham - Serves
- 1,308,955 people · Cuyahoga County
- EPA ID
- OH1801212
About this area's water
Did you know
- The Baldwin plant sits on the site of the 80-million-gallon open-air Fairmount Reservoir, in use 1885-1904 at Stokes Blvd. and MLK Jr. Dr.
- Baldwin's own reservoir held 135 million gallons and was the largest in the world when it was built in the 1920s.
- The Morgan plant honors Garrett A. Morgan, the Black inventor of the gas mask and traffic signal, who used his gas mask to rescue workers in Cleveland's 1916 waterworks tunnel disaster.
- In 2024-25 Cleveland Water ran 646 tests for lithium and 29 PFAS compounds across all four plants and detected none of them.
History5
- 1856Cleveland's first waterworks: a single pump station and 13 miles of mains delivering untreated Lake Erie water; a fountain on Public Square opened Sept. 24.
- 1918Division Avenue Filtration Plant and Pump Station opens near W. 45th St.; rededicated in 1991 as the Garrett A. Morgan Water Treatment Plant.
- 1925Baldwin Filtration Plant opens on the old Fairmount Reservoir site, delivering filtered water to all Cleveland Water customers for the first time.
- 1951-1958Nottingham plant (1951) opens for east/southeast customers and Crown plant (1958) on Clague Rd. in Westlake for west/southwest customers.
- 2023Cleveland Water launches a proactive Lead Service Line Replacement Program using federal Bipartisan Infrastructure Law funding.
Treatment & pressure
How it is treated
Lake Erie water from four offshore intakes is treated at Baldwin, Nottingham, Morgan and Crown with potassium permanganate and powdered activated carbon, coagulation, flocculation, sedimentation, filtration, chlorine, fluoride, and orthophosphate corrosion control.
Water pressure
No average psi published. Four elevation-based pressure zones also set rates; 5 primary and 13 secondary pump stations, 22 towers/tanks, ~5,400 mi of main.
What it costs
$3.13 per 1,000 gallons
2025 Cleveland residential: $9.85/mo fixed (5/8-1in meter); $23.44/MCF first 0.2 MCF, then $39.84/MCF. 1 MCF = 7,480 gal, so $3.13-$5.33 per 1,000 gal.
Water quality & impurities6
| Contaminant | Level | Limit | Year |
|---|---|---|---|
| TTHM Same LRAA at all four plants; range 9.8-65.4. Below MCL, no violation. | 39.4 ppb | 80 | 2025 |
| HAA5 Same at all four plants; range 6.0-14.7. Well below MCL. | 14.7 ppb | 60 | 2025 |
| Lead (90th percentile) Below action level, but 1 of 52 samples hit 1,997 ppb from household plumbing. | 3.15 ppb | 15 | 2024 |
| Copper (90th percentile) 0 of 52 samples above the action level. | 0.06 ppm | 1.3 | 2024 |
| Nitrate Baldwin plant; very low, typical of a Lake Erie source. | 0.45 ppm | 10 | 2025 |
| PFAS (29 compounds) and lithium 646 tests across all four plants; nothing detected. | ND ppt | UCMR5 monitoring | 2024-202… |
EPA compliance record
Lead at the tap: 90th-percentile result 0 ppb in 2024 (action level 15 ppb).
EPA record: no health-based violations since 2015.
1 violation of any kind logged since 2020: 1 for required testing that was missed or reported late.
Projects & plans3
Recent and current work
- Lead Service Line Replacement Program · 2023-present · under construction
Federal BIL funding; ~4,000 lines/yr via the program plus ~2,000 with main work, about 6,000/yr total. - Childcare facility lead line replacement · $2.5 million · 2021-2022 · completed
H2Ohio funding replaced all lead service lines at licensed childcare facilities.
Planned or needed
- System-wide lead service line replacement · planned
~178,000 possible lead connections, 142,000 city-owned; at ~6,000/yr the utility expects a 25-year effort.
Supply stress
Lake Erie supply is ample. Cleveland draws from the central basin, less affected than the western basin where Toledo's 2014 microcystin crisis cut off ~400,000 people, but harmful algal blooms remain the regional treatment risk. UCMR5 found no PFAS at any of the four plants.
Sewers
Sanitary
The Northeast Ohio Regional Sewer District (NEORSD), not Cleveland Water, provides sanitary sewer service and wastewater treatment across greater Cleveland; NEORSD operates under a federal consent decree to reduce combined sewer overflows into the Cuyahoga River and Lake Erie.
Storm
NEORSD runs a regional stormwater management program funded by a stormwater fee; much of Cleveland's older sewer system is combined sanitary/storm, the key driver of the CSO consent decree work.
Sourcesverified
Compiled from the utility's own reports and public records, then independently re-checked against primary sources.
Main supplier in 55 ZIP codes
Serves
Main water supplier in 56 ZIP codes
- 44040 · Gates Mills100% of residents
- 44056 · Macedonia100% of residents
- 44070 · North Olmsted100% of residents
- 44087 · Twinsburg100% of residents
- 44101 · Cleveland100% of residents
- 44102 · Cleveland100% of residents
- 44103 · Cleveland100% of residents
- 44104 · Cleveland100% of residents
- 44105 · Cleveland100% of residents
- 44106 · Cleveland100% of residents
- 44108 · Cleveland100% of residents
- 44109 · Cleveland100% of residents
- 44110 · Cleveland100% of residents
- 44111 · Cleveland100% of residents
- 44112 · East Cleveland and Cleveland100% of residents
- 44113 · Cleveland100% of residents
- 44114 · Cleveland100% of residents
- 44115 · Cleveland100% of residents
- 44117 · Euclid100% of residents
- 44118 · Cleveland Heights and Cleveland100% of residents
- 44119 · Cleveland100% of residents
- 44120 · Cleveland100% of residents
- 44121 · South Euclid and Cleveland100% of residents
- 44122 · Shaker Heights and Beachwood100% of residents
- 44123 · Euclid100% of residents
- 44124 · Mayfield Heights and Cleveland100% of residents
- 44125 · Garfield Heights and Cleveland100% of residents
- 44126 · Fairview Park and Cleveland100% of residents
- 44127 · Cleveland100% of residents
- 44128 · Cleveland100% of residents
- 44129 · Parma and Cleveland100% of residents
- 44130 · Parma Heights and Cleveland100% of residents
- 44131 · Seven Hills and Independence100% of residents
- 44132 · Euclid100% of residents
- 44133 · North Royalton100% of residents
- 44134 · Parma and Cleveland100% of residents
- 44135 · Cleveland100% of residents
- 44136 · Strongsville100% of residents
- 44137 · Maple Heights100% of residents
- 44140 · Bay Village100% of residents
- 44142 · Brook Park and Brookpark100% of residents
- 44143 · Richmond Heights and Cleveland100% of residents
- 44144 · Brooklyn and Cleveland100% of residents
- 44145 · Westlake100% of residents
- 44147 · Broadview Heights100% of residents
- 44116 · Rocky River100% of residents
- 44149 · Strongsville100% of residents
- 44141 · Brecksville98% of residents
- 44067 · Sagamore Hills Township and Northfield96% of residents
- 44139 · Solon93% of residents
- 44138 · Olmsted Township and Olmsted Falls91% of residents
- 44286 · Richfield83% of residents
- 44212 · Brunswick77% of residents
- 44146 · Bedford56% of residents
- 44022 · Chagrin Falls39% of residents
- 44072 · Russell Township and Novelty2% of residents
Also present in 6 more ZIP codes
- 44236 · Hudson28% of residents
- 44202 · Aurora18% of residents
- 44264 · Cuyahoga Falls and Peninsula9% of residents
- 44017 · Berea4% of residents
- 44107 · Lakewood0% of residents
- 44026 · Chester Township and Chesterland0% of residents
Population-weighted resident shares; a ZIP code can have more than one system on record. Recomputed from each ZIP's own system list, not from the map's cached footprint.
Buys from · Sells to
Cleveland Public Water System does not buy water from another system on record; it treats its own source water.
6 systems on record buy water from Cleveland Public Water System: Aurora City - Cleveland, Bedford City, Chagrin Falls Village, Columbia Park Water System, Geauga County-bainbridge, Lakewood City.
What the records show about Cleveland Public Water System
Who runs it
EPA's record describes Cleveland Public Water System as owned by a local government. It has 453,705 service connections and serves 1,308,955 people.
EPA classes it as a community water system, one that serves the same residents all year.
EPA's record says it has substantially implemented source water protection under Ohio's program, dating the program from 2023. Its office telephone on EPA's record is 216-664-2444.
Source: EPA Safe Drinking Water Information System (SDWIS), water system record.
How the water is treated
EPA's treatment table registers these steps for Cleveland Public Water System: corrosion control, coagulation and settling, chlorine disinfection, iron and manganese removal, fluoridation, powdered activated carbon, and sand or media filtration.
The list is what each system registered with EPA for treatment plants EPA still shows as active, and it can lag a plant upgrade.
Source: EPA Safe Drinking Water Information System (SDWIS) treatment table (EPA Envirofacts, pulled September 2026).
Violations
EPA's record shows no health-based violations for Cleveland Public Water System since 2015.
EPA logs 1 violation of any kind since 2020: 1 for required testing that was missed or reported late.
Source: EPA Safe Drinking Water Information System (SDWIS) violation records: health-based violations with compliance periods beginning in 2015 or later, all violations from 2020 or later (EPA Envirofacts, pulled September 2026).
Lead and copper at the tap
In the sampling period ending December 2024, the 90th-percentile lead result at Cleveland Public Water System was 0 ppb, under both the current 15 ppb action level and the 10 ppb level that applies from 2027. A result of 0 means at least nine in ten of the homes sampled had no lead detected.
The highest result on file is 1.7 ppb, in the period ending December 2018.
EPA has 3 sampling periods on file for Cleveland Public Water System since 2016, the first ending in 2018; no period was above 10 ppb.
Every water system has to inventory its service lines, the pipes from the main to each building. In the inventory Cleveland Public Water System sent EPA, 434,395 lines are counted.
| Material | Lines |
|---|---|
| Lead | 144,193 |
| Galvanized, needing replacement | 528 |
| Unknown material | 56,954 |
| Not lead | 232,720 |
| All lines | 434,395 |
Systems sample taps in the homes most likely to have lead pipes or solder. The 90th-percentile result is the level nine in ten of the sampled homes were at or below. Lead comes mostly from service lines and house plumbing, not the source water, so a low result for the system does not clear an old house.
EPA's dashboard status for this inventory: reported all required service line types.
Source: EPA Safe Drinking Water Information System (SDWIS) lead and copper 90th-percentile results (EPA Envirofacts), sampling periods ending 2016 or later; EPA's service line inventory dashboard, Ohio's 2026 Q2 submission.
PFAS
EPA's fifth national round of testing (UCMR 5) took 16 samples of the water entering the pipes of Cleveland Public Water System in 2024 to 2025 and measured 29 PFAS. No PFAS was detected, PFOA and PFOS (federal limit 4 ng/L each) among them.
Ohio EPA's own statewide sampling tested 4 plants of Cleveland Public Water System (latest sample August 2020). Not one of the six PFAS tested (PFOA, PFOS, PFHxS, PFNA, GenX and PFBS) was detected.
Ohio EPA's current sampling status map lists 4 plants of Cleveland Public Water System as sampled, most recently June 2025.
PFAS are the 'forever chemicals' from firefighting foam, plating shops and non-stick coatings. Results are for water leaving the plant, not your tap.
Source: EPA UCMR 5 occurrence data (final release, August 2026); Ohio EPA statewide PFAS sampling, 2019 to 2021, and its sampling status map.
Disinfection byproducts
Chlorine that disinfects water also reacts with organic matter to form byproducts. Two groups have federal limits: total trihalomethanes (TTHM, 80 µg/L) and five haloacetic acids (HAA5, 60 µg/L), judged on running yearly averages at each sampling site.
For TTHM, the average of Cleveland Public Water System's samples in 2019, the last year it was sampled, was 29.4 µg/L. The worst yearly average was 35.1 µg/L and the highest single sample was 75.2 µg/L, from 967 samples taken from 2012 to 2019.
For HAA5, the average in the last year sampled was 17.2 µg/L. The worst yearly average was 24.1 µg/L and the highest single sample was 55.3 µg/L, from 931 samples.
| Byproduct | Limit | Latest yearly average | Worst yearly average | Highest sample | Samples |
|---|---|---|---|---|---|
| TTHM | 80 µg/L | 29.4 µg/L (2019) | 35.1 µg/L | 75.2 µg/L | 967 |
| HAA5 | 60 µg/L | 17.2 µg/L | 24.1 µg/L | 55.3 µg/L | 931 |
A yearly average of 0 means nothing was detected in that year's samples. EPA's file stops at 2019; Ohio EPA's Drinking Water Watch has newer results.
Source: EPA Six-Year Review 4 compliance monitoring data, 2012 to 2019, distribution-system samples (non-detects counted as zero).
Nitrate, arsenic and radioactivity
Nitrate: the highest of 384 samples was 1.34 mg/L (as nitrogen) in 2013; in 2019, the last year sampled, the highest was 1.04 mg/L. No sample was over the limit of 10 mg/L. Nitrate above 10 is unsafe for infants.
Arsenic was not detected in 32 samples (limit 10 µg/L).
| Contaminant | Samples | Highest result | Limit | Samples over limit |
|---|---|---|---|---|
| Nitrate (as nitrogen) | 384 | 1.34 mg/L | 10 mg/L | 0 |
| Arsenic | 32 | not detected | 10 µg/L | 0 |
Measured in finished water: at the plant's entry points and in the distribution system; raw well and intake samples are left out. Non-detects count as zero.
EPA's file lumps the entry-point samples of all 4 plants of Cleveland Public Water System together, so a result over a limit may come from a plant that serves a different part of town.
Source: EPA Six-Year Review 4 compliance monitoring data, 2012 to 2019, finished water.
Solvents and fuels
EPA's file holds results for all six solvent and fuel compounds it checked. Benzene, carbon tetrachloride, 1,2-dichloroethane, trichloroethylene, tetrachloroethylene, and vinyl chloride were not detected in 37 samples each.
| Compound | Limit | Samples | Detected in | Highest result | Samples over limit |
|---|---|---|---|---|---|
| Benzene | 5 µg/L | 37 | 0 of 37 | not detected | 0 |
| Carbon tetrachloride | 5 µg/L | 37 | 0 of 37 | not detected | 0 |
| 1,2-dichloroethane | 5 µg/L | 37 | 0 of 37 | not detected | 0 |
| Trichloroethylene (TCE) | 5 µg/L | 37 | 0 of 37 | not detected | 0 |
| Tetrachloroethylene (PCE) | 5 µg/L | 37 | 0 of 37 | not detected | 0 |
| Vinyl chloride | 2 µg/L | 37 | 0 of 37 | not detected | 0 |
"Not detected" means the lab's result was below what its method can measure, not that the compound is absent. Non-detects count as zero in the highest-result column.
Source: EPA Six-Year Review 4 compliance monitoring data, 2012 to 2019, finished water.
Farm chemicals and metals
EPA's file holds results for 8 of the nine herbicides and metals it checked. Not detected: atrazine, alachlor, chromium, cadmium, barium, mercury, selenium, and thallium, in 32 samples each.
| Substance | Kind | Limit | Samples | Detected in | Highest result | Samples over limit |
|---|---|---|---|---|---|---|
| Atrazine | Farm chemical | 3 µg/L | 32 | 0 of 32 | not detected | 0 |
| Alachlor | Farm chemical | 2 µg/L | 32 | 0 of 32 | not detected | 0 |
| Chromium | Metal | 100 µg/L | 32 | 0 of 32 | not detected | 0 |
| Cadmium | Metal | 5 µg/L | 32 | 0 of 32 | not detected | 0 |
| Barium | Metal | 2,000 µg/L | 32 | 0 of 32 | not detected | 0 |
| Mercury | Metal | 2 µg/L | 32 | 0 of 32 | not detected | 0 |
| Selenium | Metal | 50 µg/L | 32 | 0 of 32 | not detected | 0 |
| Thallium | Metal | 2 µg/L | 32 | 0 of 32 | not detected | 0 |
Non-detects count as zero in the highest-result column.
EPA's file lumps the entry-point samples of all 4 plants of Cleveland Public Water System together, so a result over a limit may come from a plant that serves a different part of town.
Source: EPA Six-Year Review 4 compliance monitoring data, 2012 to 2019, finished water.
Bacteria in the pipes
From 2012 to 2019, 16 of 35,386 routine total coliform samples taken in the distribution system at Cleveland Public Water System tested positive (0.05%); in 2019, the last year on file, 1 of 4,568 did. E. coli was found in 3 of 36 samples tested for it.
A positive coliform test is a warning sign, not a violation by itself. E. coli is a sign that human or animal waste may have reached the water. Coliform counts are routine samples only; E. coli counts include repeat samples.
Source: EPA Six-Year Review 4 compliance monitoring data, 2012 to 2019, distribution-system presence/absence tests for total coliform and E. coli.
Fluoride
The Ohio Department of Health's report to the CDC (My Water's Fluoride) says Cleveland Public Water System adjusts the fluoride level to the recommended level for preventing tooth decay.
EPA's treatment table lists fluoridation among the steps at Cleveland Public Water System.
Measured fluoride: 0.93 mg/L on average at the plant's entry points in 2019 (in the range dentists aim for); samples ran from 0.81 to 1.38 mg/L across 380 samples in 2012 to 2019.
The recommended level for preventing tooth decay is 0.7 mg/L; the federal limit is 4 mg/L. The treatment list is what each system registered with EPA and can lag a plant upgrade.
Source: CDC My Water's Fluoride (fluoridation status as reported by the Ohio Department of Health, fetched September 2026); EPA Safe Drinking Water Information System (SDWIS) treatment table; EPA Six-Year Review 4 compliance monitoring data, 2012 to 2019, entry-point fluoride samples.
Lithium
Lithium was not detected in 16 UCMR 5 samples at Cleveland Public Water System, last sampled in 2025 (the method reports from 9 µg/L).
Lithium is not regulated. EPA's draft health reference level is 10 µg/L, and it occurs naturally in deep groundwater, so well systems in the northwest run highest.
Source: EPA UCMR 5 occurrence data (final release, August 2026), samples from 2023 to 2025.
Algal toxins
Ohio EPA tests for microcystin, a toxin that harmful algal blooms can release, in raw water at the intake and in treated water.
At the intake, microcystin was detected 2 times in 1,068 raw-water samples, across 1 bloom season (2018); the highest raw-water result was 0.38 µg/L on September 10, 2018. There has been no raw-water detection since 2024.
Microcystin was never detected in treated water (1,137 samples).
In all, 2,205 samples from 2016 to 2026, the latest on August 24, 2026.
| Water | Samples | Detections | Highest result |
|---|---|---|---|
| Raw water, at the intake | 1,068 | 2 | 0.38 µg/L |
| Treated water | 1,137 | 0 | not detected |
The ten-day advisory levels for treated water are 0.3 µg/L for children under six and 1.6 µg/L for everyone else. Any detection at the intake triggers more frequent testing until two clean weeks.
Source: Ohio EPA public water system harmful algal bloom monitoring, 2016 to present (HAB data, fetched September 2026).
Water and sewer bills
Ohio EPA's 2023 rate survey puts the water bill at Cleveland Public Water System for a household using 5,000 gallons a month at $372 a year, about $31 a month.
| Use | Water, per year | Sewer, per year |
|---|---|---|
| 2,500 gallons a month | $223 | not on file |
| 5,000 gallons a month | $372 | not on file |
| 8,000 gallons a month | $550 | not on file |
The survey lists it as “Cleveland”. These are inside-city rates and annual bills at the use shown.
Source: Ohio EPA 2023 Sewer and Water Rate Survey (Ohio State University, May 2025).
How well the service area is mapped
The service area drawn on the map for Cleveland Public Water System comes from the utility's own map.
Counting the people who live in the ZIP codes it overlaps, this atlas estimates 1,280,365 residents are inside the boundary, 98% of the 1,308,955 people Cleveland Public Water System reports serving.
The resident count is an estimate from 2020 Census ZIP-code populations, not a count of customers.
Source: EPA Service Area Boundaries; resident estimate by this atlas from ZIP-code overlap.
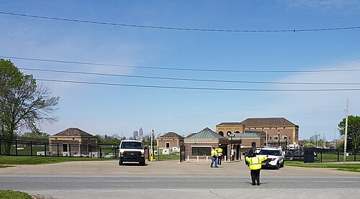
Photograph
On the map
Show this system's territory on the map — 62 ZIP codes in all.
Sources
U.S. EPA SDWIS and Community Water System Service Area Boundaries (v3, 2026), Ohio EPA primacy data, 2020 census blocks: the system serving most residents, traced through purchases to the treating utility; Ohio EPA 2023 Sewer and Water Rate Survey (Ohio State, May 2025) for household bills; Ohio EPA DEFA loan awards since 2016 for the loans paragraph · EPA SDWIS · EPA service area boundaries · Ohio EPA drinking water · Ohio EPA rate survey
EPA's own record for this system: Enforcement and Compliance History report for OH1801212 (EPA ECHO).
Cleveland Public Water System's own pages: clevelandwater.com