Plays from YouTube when you press play.
Then and now · 2026-10-22
Both Numbers Are True: Ohio's Lowest Unemployment Ever and 5.9 Million Pantry Visits
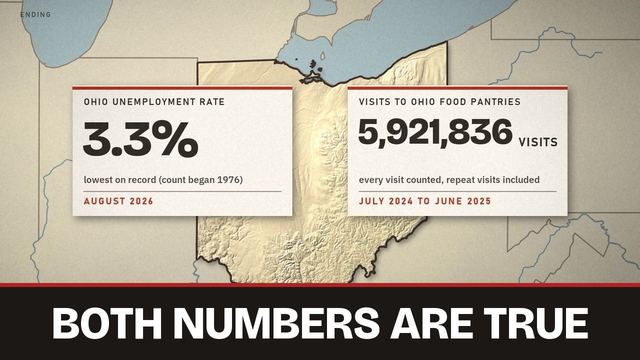
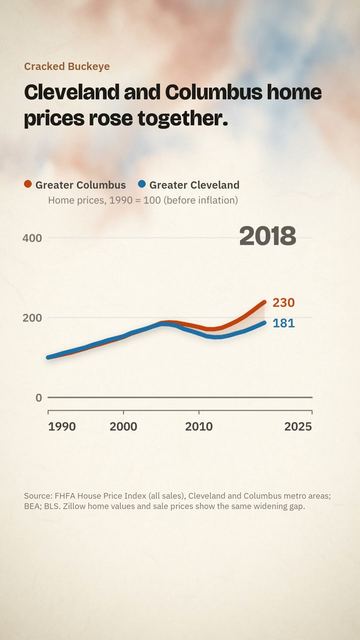
In August 2026, Ohio's unemployment rate fell to 3.3 percent, the lowest since the count began in 1976. In the year to June 2025, Ohio's food banks counted 5,921,836 pantry visits, the most in any of their annual reports since 2019. Both numbers are true; this film takes each apart through the shelf, the house, the electric bill, a century of Ohio prices and every presidential term since 2001 on the same measures.
Chapters
0:00 Cold open
2:02 The number
5:17 The shelf
7:38 Both numbers, taken apart
11:05 The house
14:33 The bill
22:01 The rest of the table, and the register
24:45 The long view
26:41 The question you're already asking
30:00 Ending
WHAT IS MEASURED WHERE
No state has its own price index. BLS prices goods in four Ohio areas (Cleveland, Columbus, Dayton, Cincinnati) and prints them only inside one index for its 12-state Midwest region.
- MIDWEST (stamped on screen): that index, and the Midwest grocery prices behind "minutes of work".
- OHIO: unemployment, jobs, pay, EIA fuel and power prices, Census rents, Zillow home values, PUCO bills, property and sales tax, insurance, health premiums, food bank visits.
- U.S.: the price index in the presidents table, the CPI-W behind the minimum wage and Social Security, the car payment, the health-insurance index, the shutdown rent research, store sales.
THE PRESIDENTS TABLE, IN FULL
Method: January of the first year to January four years later; the current term to Sept. 2026 (20 months). U.S. prices (CPI-U) and jobs seasonally adjusted; BLS and BEA via FRED, recomputed Oct. 20, 2026. 19 countries: BIS, each country's own index, not seasonally adjusted for any term (so the U.S. figure there can differ from ours by a few tenths); the G7 plus Australia, Korea, Mexico, Spain, Netherlands, Sweden, Switzerland, Poland, Brazil, India, Ireland, New Zealand, chosen by us. No color coding.
Columns: U.S. prices total / per year / first 20 months / per year without food and energy | U.S. rank of 19 (U.S., median; lowest, highest) | jobs Ohio / U.S. | Ohio unemployment | real GDP a year Ohio / U.S. | U.S. gas low-high
Bush 2001-05: +9.1 / 2.2 / +3.0 / 2.0 | 13th (8.9, 9.6; Japan -2.0, Brazil +42.5) | -3.5 / +0.1 | 3.9 to 6.3 | 1.4 / 2.3 | $1.09-2.00
Bush 2005-09: +10.6 / 2.6 / +5.8 / 2.2 | 9th (10.7, 10.3; Japan +0.6, India +23.0) | -3.6 / +1.0 | 6.3 to 8.8 | 0.4 / 2.1 | $1.69-4.06
Obama 2009-13: +9.3 / 2.3 / +3.0 / 1.7 | 11th (9.1, 9.1; Japan -1.8, India +34.2) | +0.4 / +0.9 | 8.8 to 7.5 | 0.3 / 1.0 | $1.79-3.91
Obama 2013-17: +5.2 / 1.3 / +2.5 / 1.9 | 6th (5.5, 4.3; Switzerland -1.3, Brazil +31.9) | +5.4 / +7.7 | 7.5 to 5.2 | 2.1 / 2.4 | $1.76-3.71
Trump 2017-21: +7.8 / 1.9 / +3.5 / 1.9 | 5th (7.7, 6.7; Switzerland +1.0, India +20.0) | -3.3 / -1.9 | 5.2 to 6.1 | 0.8 / 1.5 | $1.84-2.90
Biden 2021-25: +21.4 / 5.0 / +12.8 / 4.7 | 9th (21.4, 20.0; Switzerland +6.8, Poland +40.7) | +6.0 / +10.8 | 6.1 to 4.8 | 2.3 / 3.6 | $2.33-4.93
Trump 2025 to Sept. 2026 (20 months) [LIVE]: +5.4 / 3.2 / +5.4 / 2.6 | 5th over 17 months to June 2026 (5.1, 4.7; Sweden +1.2, Brazil +7.6) | +0.6 / +0.5 | 4.8 to 3.4 | 2.4 / 2.3 (2024-25 only) | $2.81-4.48
All figures percent except gas (monthly average, dollars a gallon). Ohio's price rise is not published; the Midwest series is not Ohio. GDP runs from the year before the term to the last full year; Biden's starts in the 2020 trough, Trump's first term ends in it. Recessions or the pandemic bend the jobs of Bush 2001-05 (starts two months before the 2001 recession), Bush 2005-09, Obama 2009-13, Trump 2017-21 and Biden 2021-25. Energy swings move every term's total (2004, 2008, 2011, 2014-16, 2020, 2022, 2026), hence the column without food and energy. Comparing spans describes; it does not prove cause.
[LIVE] Figures as of Oct. 20, 2026: September CPI +3.7% over 12 months; 2027 Social Security raise 3.6%; Ohio's September unemployment 3.4% (August's 3.3% is still the series low). The 2027 Medicare premium comes in November.
Sources: BLS, EIA, BEA, Census Bureau, PJM and its Market Monitor, the Federal Reserve Board and the Cleveland, San Francisco and Minneapolis Feds, FRED, NBER, BIS, Ohio Association of Foodbanks, Ohio OBM, Ohio LSC, PUCO, Ohio Consumers' Counsel, Ohio Taxation, Ohio Commerce, SSA, CMS, AHRQ, NAIC, STRS Ohio, Freddie Mac, Zillow, HUD, USDA, APHIS, U.S. Energy Department, Senate Special Committee on Aging, Library of Congress, National Archives, county auditors. Reporting quoted: AP, Ohio Capital Journal, WOSU, WYSU, ABC6/WSYX, CW Columbus, Dayton Daily News, WFMJ, Cleveland Magazine.
Pictures and film are credited on screen at the end. The full credit list, the full quotations and the facts the screen could not hold are in the pinned comment.
Truth first, wherever it lands. If we got something wrong, tell us and we will correct it openly.
Watch on YouTube. Follow us on YouTube, TikTok, Facebook, Instagram.
More videos


Cite this page
Cite this page as:
Cracked Buckeye, "Both Numbers Are True: Ohio's Lowest Unemployment Ever and 5.9 Million Pantry Visits", https://crackedbuckeye.com/videos/both-numbers-are-true-ohio-s-lowest-unemployment-ever-and-5-9/, built 2026-10-31, accessed [date].
How to cite · Report a correction · Built 2026-10-31